Estimated Value: $1,357,000 - $2,528,140
6
Beds
2
Baths
3,360
Sq Ft
$599/Sq Ft
Est. Value
About This Home
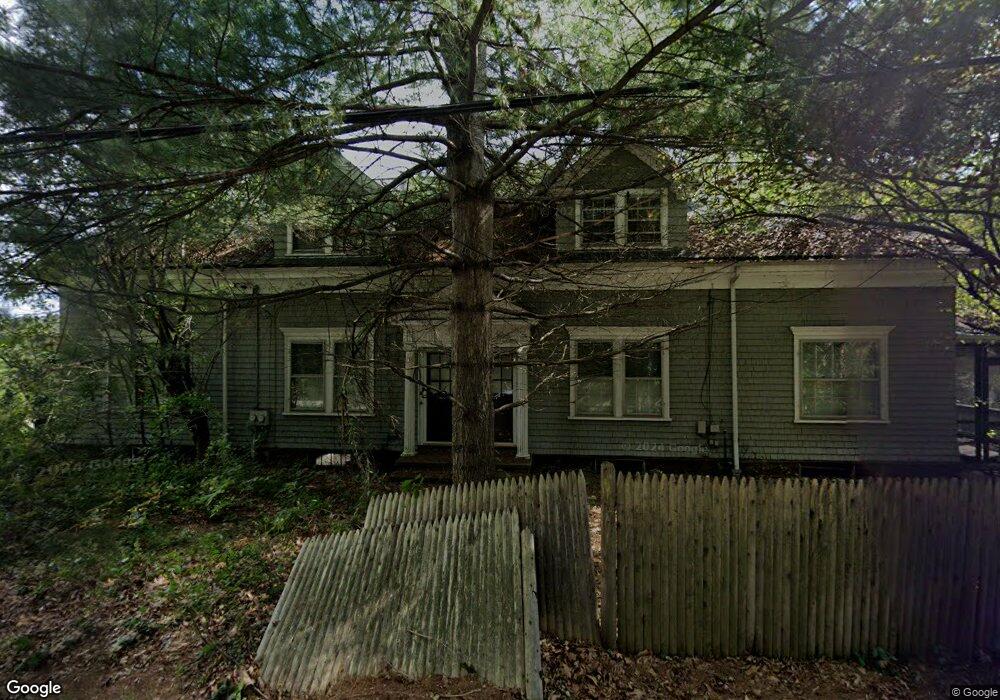
This home is located at 8 Farm St Unit 8A, Dover, MA 02030 and is currently estimated at $2,014,285, approximately $599 per square foot. 8 Farm St Unit 8A is a home located in Norfolk County with nearby schools including Chickering Elementary School, Dover-Sherborn Regional Middle School, and Dover-Sherborn Regional High School.
Ownership History
Date
Name
Owned For
Owner Type
Purchase Details
Closed on
Oct 23, 2003
Sold by
Bagg Dover Nt and Donham Priscilla B
Bought by
6 Farm St Rt and Oliva Anthony B
Current Estimated Value
Home Financials for this Owner
Home Financials are based on the most recent Mortgage that was taken out on this home.
Original Mortgage
$650,000
Outstanding Balance
$302,079
Interest Rate
6.15%
Mortgage Type
Purchase Money Mortgage
Estimated Equity
$1,712,206
Create a Home Valuation Report for This Property
The Home Valuation Report is an in-depth analysis detailing your home's value as well as a comparison with similar homes in the area
Home Values in the Area
Average Home Value in this Area
Purchase History
| Date | Buyer | Sale Price | Title Company |
|---|---|---|---|
| 6 Farm St Rt | $1,725,000 | -- |
Source: Public Records
Mortgage History
| Date | Status | Borrower | Loan Amount |
|---|---|---|---|
| Open | 6 Farm St Rt | $650,000 |
Source: Public Records
Tax History Compared to Growth
Tax History
| Year | Tax Paid | Tax Assessment Tax Assessment Total Assessment is a certain percentage of the fair market value that is determined by local assessors to be the total taxable value of land and additions on the property. | Land | Improvement |
|---|---|---|---|---|
| 2025 | $11,921 | $1,057,800 | $772,000 | $285,800 |
| 2024 | $12,501 | $1,140,600 | $772,000 | $368,600 |
| 2023 | $11,967 | $981,700 | $669,800 | $311,900 |
| 2022 | $15,341 | $1,235,200 | $923,300 | $311,900 |
| 2021 | $17,779 | $1,379,300 | $923,300 | $456,000 |
| 2020 | $17,710 | $1,379,300 | $923,300 | $456,000 |
| 2019 | $17,834 | $1,379,300 | $923,300 | $456,000 |
| 2018 | $17,848 | $1,390,000 | $958,700 | $431,300 |
| 2017 | $18,424 | $1,411,800 | $980,500 | $431,300 |
| 2016 | $18,254 | $1,417,200 | $985,900 | $431,300 |
| 2015 | $17,998 | $1,417,200 | $985,900 | $431,300 |
Source: Public Records
Map
Nearby Homes
- 3 Burnham Rd
- 12 Haven St
- 8 Normandie Rd
- 25 Bretton Rd
- 150 Dedham St
- 12 Cranberry Ln
- 52 Willow St
- 178 Dedham St
- 46 Charles River St
- 62 Walpole St
- 15-19 Strawberry Hill St
- 1780 Central Ave
- 1266 South St
- 15 Woodridge Rd
- 1 Windsor Rd
- 365 Charles River St
- 267 Dedham St
- 49 Powisset St
- 90 Burr Dr
- 15 Wilsondale St