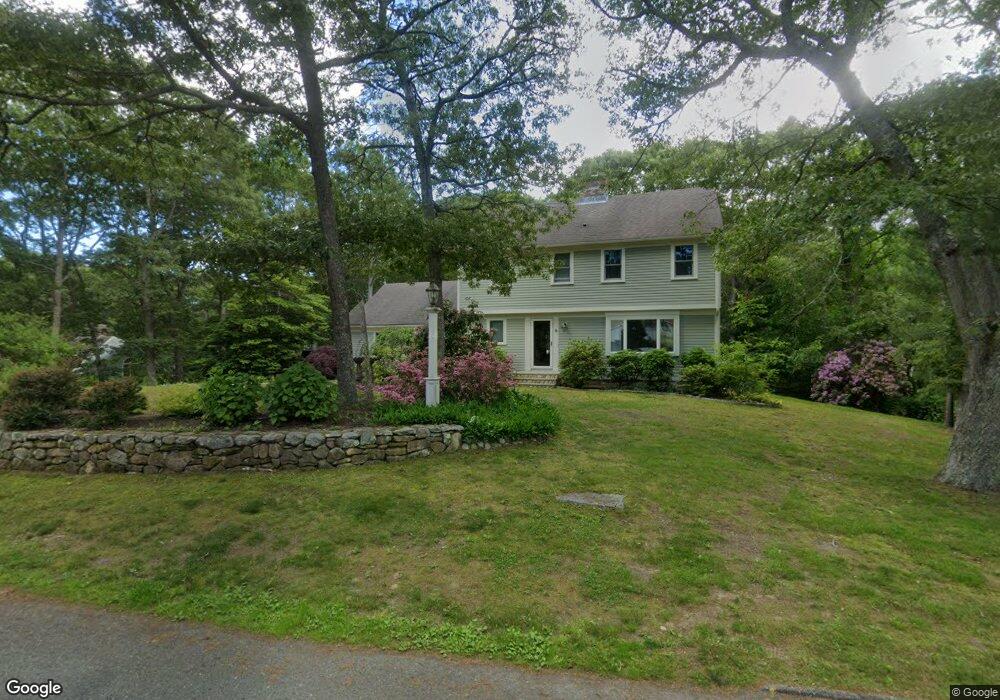
8 Fox Run East Sandwich, MA 02537
Estimated Value: $758,238 - $876,000
4
Beds
3
Baths
1,836
Sq Ft
$450/Sq Ft
Est. Value
About This Home
This home is located at 8 Fox Run, East Sandwich, MA 02537 and is currently estimated at $827,060, approximately $450 per square foot. 8 Fox Run is a home located in Barnstable County with nearby schools including Sandwich Middle High School and Riverview School.
Ownership History
Date
Name
Owned For
Owner Type
Purchase Details
Closed on
Sep 16, 2024
Sold by
Kamb Robert W and Kamb Rebecca C
Bought by
Kamb Rebecca C and Kamb
Current Estimated Value
Purchase Details
Closed on
Oct 20, 2000
Sold by
Kamb John S and Kamb Patrice D
Bought by
Kamb Robert W and Kamb Rebecca C
Create a Home Valuation Report for This Property
The Home Valuation Report is an in-depth analysis detailing your home's value as well as a comparison with similar homes in the area
Home Values in the Area
Average Home Value in this Area
Purchase History
| Date | Buyer | Sale Price | Title Company |
|---|---|---|---|
| Kamb Rebecca C | -- | None Available | |
| Rebecca C Kamb Ft | -- | None Available | |
| Kamb Rebecca C | -- | None Available | |
| Kamb Robert W | $255,000 | -- | |
| Kamb Robert W | $255,000 | -- |
Source: Public Records
Mortgage History
| Date | Status | Borrower | Loan Amount |
|---|---|---|---|
| Previous Owner | Kamb Robert W | $363,600 | |
| Previous Owner | Kamb Robert W | $226,500 |
Source: Public Records
Tax History Compared to Growth
Tax History
| Year | Tax Paid | Tax Assessment Tax Assessment Total Assessment is a certain percentage of the fair market value that is determined by local assessors to be the total taxable value of land and additions on the property. | Land | Improvement |
|---|---|---|---|---|
| 2025 | $6,716 | $635,400 | $130,600 | $504,800 |
| 2024 | $6,429 | $595,300 | $116,700 | $478,600 |
| 2023 | $6,190 | $538,300 | $106,100 | $432,200 |
| 2022 | $6,164 | $468,400 | $119,900 | $348,500 |
| 2021 | $5,859 | $425,500 | $115,300 | $310,200 |
| 2020 | $5,907 | $412,800 | $118,600 | $294,200 |
| 2019 | $5,705 | $398,400 | $122,200 | $276,200 |
| 2018 | $2,424 | $369,300 | $112,400 | $256,900 |
| 2017 | $2,361 | $365,400 | $125,100 | $240,300 |
| 2016 | $5,138 | $355,100 | $120,600 | $234,500 |
| 2015 | $4,972 | $335,500 | $111,600 | $223,900 |
Source: Public Records
Map
Nearby Homes
- 6 Harpers Hollow
- 11 Locust Ln
- 50 Wayside Ln
- 58 Williams Path
- 665 Route 6a
- 665 Old King's Hwy
- 120 Berkshire Trail
- 41 Coventry Ln
- 75 Old Toll Rd
- 3 Mulberry Cir
- 205 Carlson Ln
- 566 Route 6a
- 7 Oak Ridge Rd
- 515 Cedar St
- 159 Great Hill Rd
- 0 Captain Kidd Rd
- 70 Wing Blvd E
- 507 Massachusetts 6a Unit 9
- 339 Cedar St
- 12 Pine Terrace