Estimated Value: $412,000 - $436,000
4
Beds
3
Baths
2,700
Sq Ft
$157/Sq Ft
Est. Value
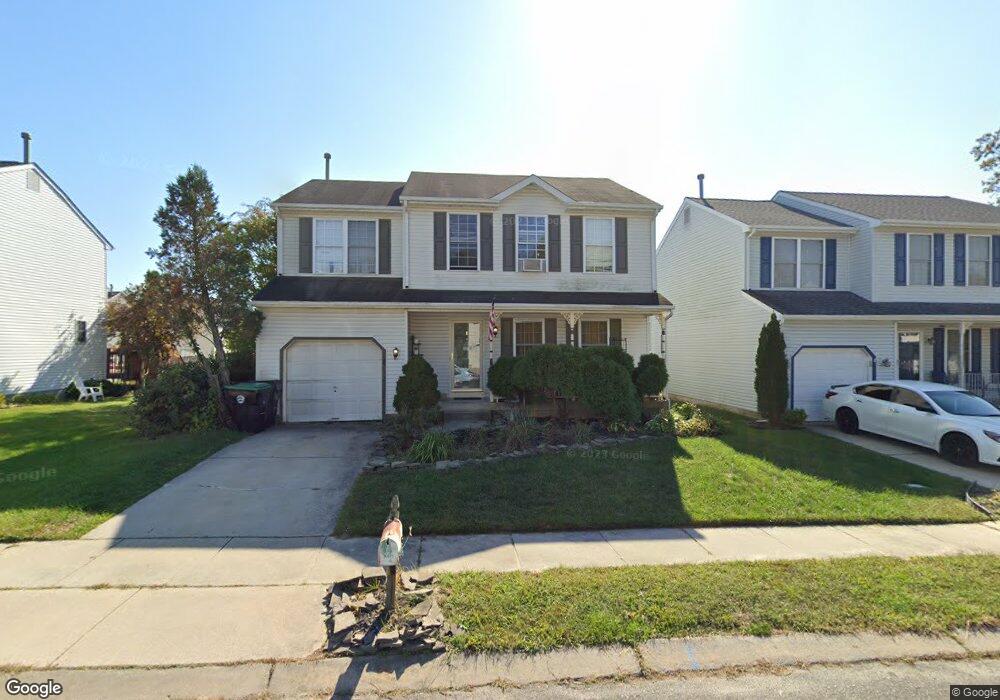
About This Home
This home is located at 8 Foxton Dr, Atco, NJ 08004 and is currently estimated at $424,758, approximately $157 per square foot. 8 Foxton Dr is a home located in Camden County with nearby schools including Winslow Township High School, Our Lady Of Mt Carmel School, and The Archway School.
Ownership History
Date
Name
Owned For
Owner Type
Purchase Details
Closed on
Nov 13, 2009
Sold by
Cancelliere Samuel G and Cancelliere Renee M
Bought by
Torres Maricel and Dagotdot Bryan
Current Estimated Value
Home Financials for this Owner
Home Financials are based on the most recent Mortgage that was taken out on this home.
Original Mortgage
$222,883
Outstanding Balance
$144,488
Interest Rate
4.86%
Mortgage Type
FHA
Estimated Equity
$280,270
Purchase Details
Closed on
Jan 6, 2006
Sold by
Volponi Joseph H
Bought by
Patton Charles and Patton Ramona
Home Financials for this Owner
Home Financials are based on the most recent Mortgage that was taken out on this home.
Original Mortgage
$235,200
Interest Rate
6.23%
Purchase Details
Closed on
May 27, 1997
Sold by
Group Ten Builders Inc
Bought by
Angelucci Renee M and Cancelliere Samuel G
Home Financials for this Owner
Home Financials are based on the most recent Mortgage that was taken out on this home.
Original Mortgage
$125,000
Interest Rate
7.98%
Mortgage Type
FHA
Create a Home Valuation Report for This Property
The Home Valuation Report is an in-depth analysis detailing your home's value as well as a comparison with similar homes in the area
Home Values in the Area
Average Home Value in this Area
Purchase History
| Date | Buyer | Sale Price | Title Company |
|---|---|---|---|
| Torres Maricel | $227,000 | -- | |
| Patton Charles | $269,000 | -- | |
| Angelucci Renee M | $129,350 | -- |
Source: Public Records
Mortgage History
| Date | Status | Borrower | Loan Amount |
|---|---|---|---|
| Open | Torres Maricel | $222,883 | |
| Previous Owner | Patton Charles | $235,200 | |
| Previous Owner | Angelucci Renee M | $125,000 |
Source: Public Records
Tax History
| Year | Tax Paid | Tax Assessment Tax Assessment Total Assessment is a certain percentage of the fair market value that is determined by local assessors to be the total taxable value of land and additions on the property. | Land | Improvement |
|---|---|---|---|---|
| 2025 | $8,479 | $217,300 | $45,000 | $172,300 |
| 2024 | $8,255 | $217,300 | $45,000 | $172,300 |
| 2023 | $8,255 | $217,300 | $45,000 | $172,300 |
| 2022 | $8,001 | $217,300 | $45,000 | $172,300 |
| 2021 | $7,910 | $217,300 | $45,000 | $172,300 |
| 2020 | $7,840 | $217,300 | $45,000 | $172,300 |
| 2019 | $7,792 | $217,300 | $45,000 | $172,300 |
| 2018 | $7,686 | $217,300 | $45,000 | $172,300 |
| 2017 | $7,549 | $217,300 | $45,000 | $172,300 |
| 2016 | $7,453 | $217,300 | $45,000 | $172,300 |
| 2015 | $7,345 | $217,300 | $45,000 | $172,300 |
| 2014 | $7,182 | $217,300 | $45,000 | $172,300 |
Source: Public Records
Map
Nearby Homes
- 56 Oakton Dr
- 9 Bromley Ct
- 33 Windingbrook Dr
- 18 Wakefield Rd
- 470 Waterfords Edge Ct
- 59 Woodstream Dr
- 158 Baker Ave
- 10 Dartmouth Dr
- 22 Josie Ln
- 61 Virginia Dr
- 2107 Cooper Rd
- 108 Forbes Dr
- 21 Briarcliff Rd
- 295 White Horse Pike
- 2157 Almira Ave
- 2172 Atco Ave
- 2216 Harrison Ave
- 58 Sweetgum Rd
- 56 Sweetgum Rd
- 46 Sweetgum Rd
Your Personal Tour Guide
Ask me questions while you tour the home.