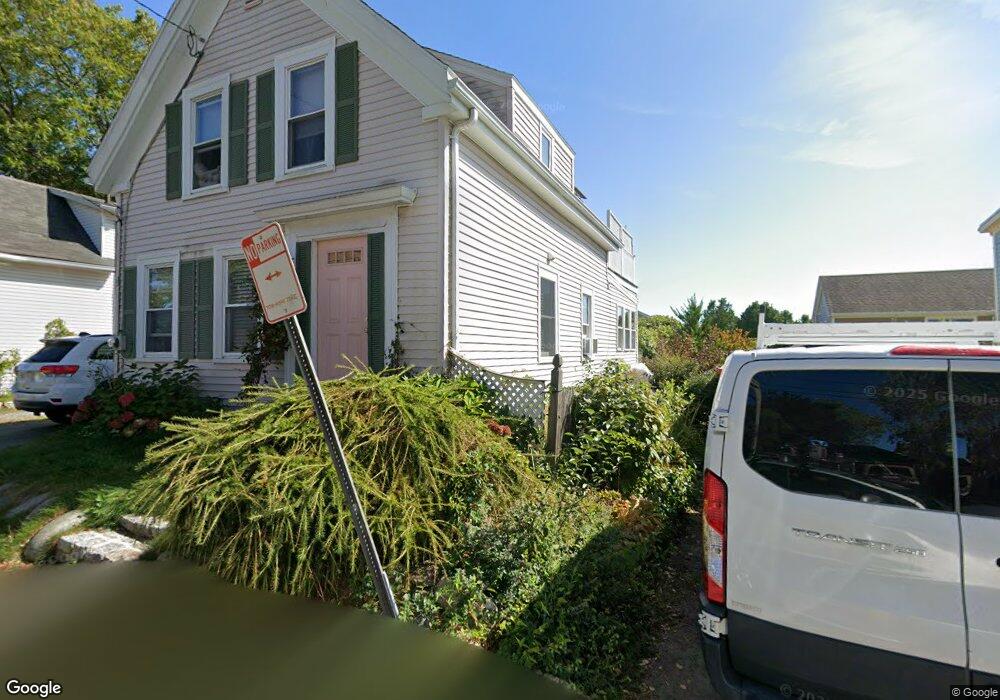
8 Fremont St Gloucester, MA 01930
East Gloucester NeighborhoodEstimated Value: $613,000 - $934,000
2
Beds
2
Baths
948
Sq Ft
$894/Sq Ft
Est. Value
About This Home
This home is located at 8 Fremont St, Gloucester, MA 01930 and is currently estimated at $847,186, approximately $893 per square foot. 8 Fremont St is a home located in Essex County with nearby schools including East Gloucester Elementary School, Ralph B O'maley Middle School, and Gloucester High School.
Ownership History
Date
Name
Owned For
Owner Type
Purchase Details
Closed on
Jun 25, 1999
Sold by
Smith Gerald J and Smith Patricia G
Bought by
Roopenian Alan S and Roopenian Andrea R
Current Estimated Value
Purchase Details
Closed on
Feb 23, 1995
Sold by
Johanson Jean R
Bought by
Smith Gerard J and Smith Patricia
Create a Home Valuation Report for This Property
The Home Valuation Report is an in-depth analysis detailing your home's value as well as a comparison with similar homes in the area
Home Values in the Area
Average Home Value in this Area
Purchase History
| Date | Buyer | Sale Price | Title Company |
|---|---|---|---|
| Roopenian Alan S | $255,000 | -- | |
| Smith Gerard J | $163,000 | -- |
Source: Public Records
Mortgage History
| Date | Status | Borrower | Loan Amount |
|---|---|---|---|
| Open | Smith Gerard J | $318,000 | |
| Closed | Smith Gerard J | $300,522 | |
| Closed | Smith Gerard J | $300,000 |
Source: Public Records
Tax History
| Year | Tax Paid | Tax Assessment Tax Assessment Total Assessment is a certain percentage of the fair market value that is determined by local assessors to be the total taxable value of land and additions on the property. | Land | Improvement |
|---|---|---|---|---|
| 2025 | $8,459 | $870,300 | $605,100 | $265,200 |
| 2024 | $8,164 | $839,100 | $576,200 | $262,900 |
| 2023 | $7,905 | $746,500 | $491,600 | $254,900 |
| 2022 | $7,567 | $645,100 | $427,700 | $217,400 |
| 2021 | $7,331 | $589,300 | $388,900 | $200,400 |
| 2020 | $7,139 | $579,000 | $388,900 | $190,100 |
| 2019 | $6,844 | $539,300 | $370,800 | $168,500 |
| 2018 | $6,636 | $513,200 | $361,800 | $151,400 |
| 2017 | $6,421 | $486,800 | $344,400 | $142,400 |
| 2016 | $6,499 | $477,500 | $329,600 | $147,900 |
| 2015 | $6,431 | $471,100 | $333,200 | $137,900 |
Source: Public Records
Map
Nearby Homes
- 1 Wonson St
- 73 Rocky Neck Ave Unit 2
- 60 Rocky Neck Ave Unit 202
- 15 Raven Ln Unit 15
- 197 E Main St Unit 1
- 191 Main St Unit 3
- 191 Main St Unit 2A
- 30 Chapel St Unit B
- 10 Seaview Rd
- 33 Middle St
- 35 Middle St Unit 4
- 11 Ocean View Dr
- 139A Prospect St
- 15 Mount Vernon St
- 20 Beacon St
- 20 Beacon St Unit 2
- 20 Beacon St Unit 1
- 113 Pleasant St
- 33 Maplewood Ave Unit 310
- 50 Warner St
- 8 Fremont St
- 8 Fremont St Unit 2
- 8 Freemont Street: Winter Unit 2
- 10 Fremont St
- 6 Fremont St
- 5 Fremont St
- 7 Fremont St
- 12 Rackliffe St
- 4 Wonson St
- 6 Rackliffe St
- 2 Wonson St
- 6 Wonson St
- 11 Rackliffe St
- 11 Rackliffe St Unit 1
- 6 Bickford Way
- 10 Bickford Way
- 13 Rackliffe St
- 2 Fremont St Unit 5
- 2 Fremont St Unit 4
- 2 Fremont St Unit 3
Your Personal Tour Guide
Ask me questions while you tour the home.