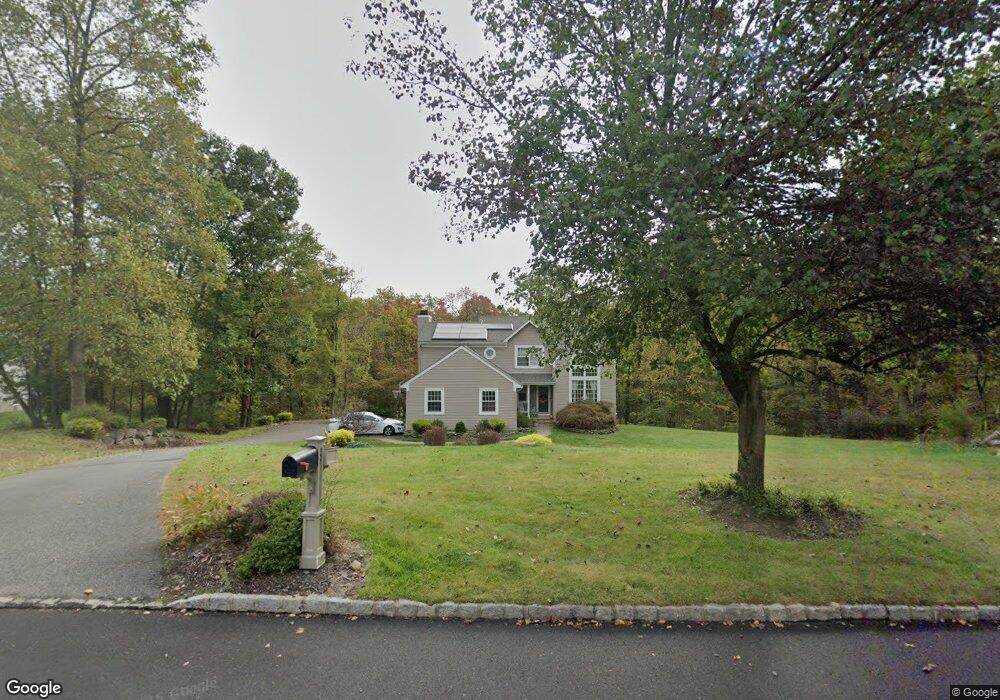
8 Gary Ct Flanders, NJ 07836
Estimated Value: $709,499 - $736,000
Studio
--
Bath
2,190
Sq Ft
$328/Sq Ft
Est. Value
About This Home
This home is located at 8 Gary Ct, Flanders, NJ 07836 and is currently estimated at $718,625, approximately $328 per square foot. 8 Gary Ct is a home located in Morris County with nearby schools including Mt Olive Middle School and Mount Olive High School.
Ownership History
Date
Name
Owned For
Owner Type
Purchase Details
Closed on
Feb 18, 1999
Sold by
Burrows Carl W and Burrows Helen C
Bought by
Shelley James and Shelley Diane
Current Estimated Value
Home Financials for this Owner
Home Financials are based on the most recent Mortgage that was taken out on this home.
Original Mortgage
$195,000
Outstanding Balance
$46,234
Interest Rate
6.76%
Estimated Equity
$672,391
Purchase Details
Closed on
Feb 11, 1997
Sold by
Burns Emmet R and Burns Jean M
Bought by
Burrows Carl W and Burrows Helen C
Home Financials for this Owner
Home Financials are based on the most recent Mortgage that was taken out on this home.
Original Mortgage
$207,000
Interest Rate
6.12%
Purchase Details
Closed on
Oct 27, 1994
Sold by
Rickland Assoc
Bought by
Burns Emmet and Burns Jean
Home Financials for this Owner
Home Financials are based on the most recent Mortgage that was taken out on this home.
Original Mortgage
$230,000
Interest Rate
8.78%
Create a Home Valuation Report for This Property
The Home Valuation Report is an in-depth analysis detailing your home's value as well as a comparison with similar homes in the area
Home Values in the Area
Average Home Value in this Area
Purchase History
| Date | Buyer | Sale Price | Title Company |
|---|---|---|---|
| Shelley James | $295,000 | -- | |
| Burrows Carl W | $259,000 | -- | |
| Burns Emmet | $255,000 | -- |
Source: Public Records
Mortgage History
| Date | Status | Borrower | Loan Amount |
|---|---|---|---|
| Open | Shelley James | $195,000 | |
| Previous Owner | Burrows Carl W | $207,000 | |
| Previous Owner | Burns Emmet | $230,000 |
Source: Public Records
Tax History
| Year | Tax Paid | Tax Assessment Tax Assessment Total Assessment is a certain percentage of the fair market value that is determined by local assessors to be the total taxable value of land and additions on the property. | Land | Improvement |
|---|---|---|---|---|
| 2025 | $13,839 | $397,100 | $178,800 | $218,300 |
| 2024 | $13,053 | $397,100 | $178,800 | $218,300 |
Source: Public Records
Map
Nearby Homes
Your Personal Tour Guide
Ask me questions while you tour the home.