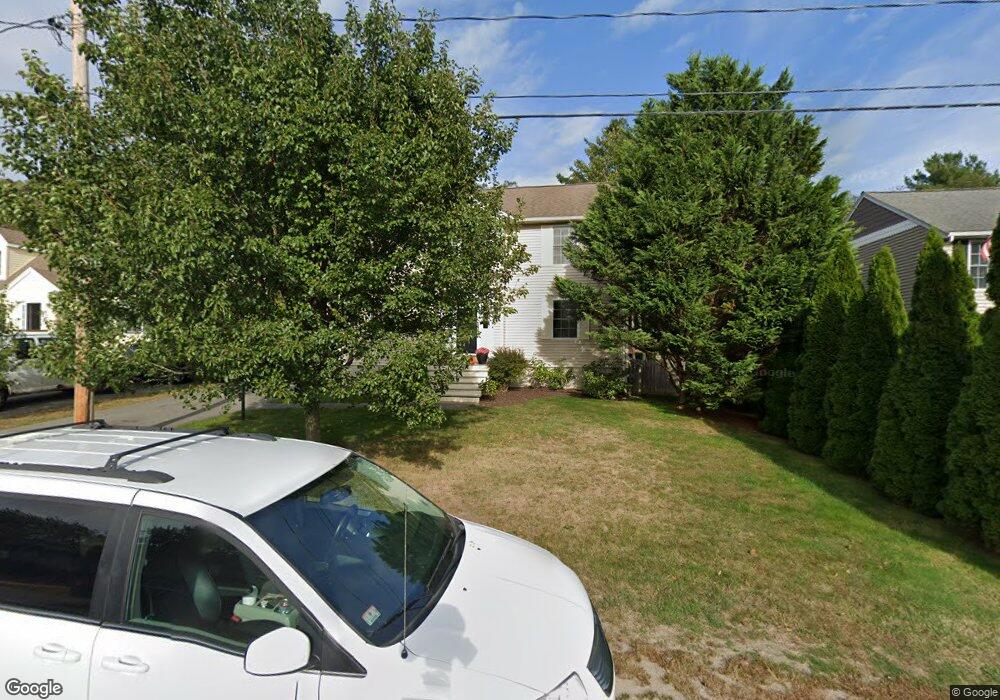
8 Glenda Ave Wareham, MA 02571
Wareham Center NeighborhoodEstimated Value: $497,000 - $617,000
3
Beds
2
Baths
1,904
Sq Ft
$300/Sq Ft
Est. Value
About This Home
This home is located at 8 Glenda Ave, Wareham, MA 02571 and is currently estimated at $571,023, approximately $299 per square foot. 8 Glenda Ave is a home located in Plymouth County with nearby schools including Tabor Academy.
Ownership History
Date
Name
Owned For
Owner Type
Purchase Details
Closed on
Feb 10, 2011
Sold by
8 Glendale Road Rt and Pasquantonio
Bought by
8 Glendale Road Rt and Diede
Current Estimated Value
Purchase Details
Closed on
Apr 12, 2002
Sold by
Bronk Donna M
Bought by
Young Suzanne E
Purchase Details
Closed on
Aug 17, 2000
Sold by
Spinali Giuseppe and Spinali Maria
Bought by
8 Glendale Rd Rt
Create a Home Valuation Report for This Property
The Home Valuation Report is an in-depth analysis detailing your home's value as well as a comparison with similar homes in the area
Home Values in the Area
Average Home Value in this Area
Purchase History
| Date | Buyer | Sale Price | Title Company |
|---|---|---|---|
| 8 Glendale Road Rt | $25,000 | -- | |
| 8 Glendale Road Rt | $25,000 | -- | |
| Young Suzanne E | $186,900 | -- | |
| Young Suzanne E | $186,900 | -- | |
| 8 Glendale Rd Rt | $57,000 | -- | |
| 8 Glendale Rd Rt | $57,000 | -- |
Source: Public Records
Mortgage History
| Date | Status | Borrower | Loan Amount |
|---|---|---|---|
| Previous Owner | 8 Glendale Rd Rt | $20,000 | |
| Previous Owner | 8 Glendale Rd Rt | $260,000 |
Source: Public Records
Tax History Compared to Growth
Tax History
| Year | Tax Paid | Tax Assessment Tax Assessment Total Assessment is a certain percentage of the fair market value that is determined by local assessors to be the total taxable value of land and additions on the property. | Land | Improvement |
|---|---|---|---|---|
| 2025 | $4,936 | $473,700 | $107,600 | $366,100 |
| 2024 | $4,964 | $442,000 | $83,400 | $358,600 |
| 2023 | $4,349 | $391,600 | $75,800 | $315,800 |
| 2022 | $4,349 | $330,000 | $75,800 | $254,200 |
| 2021 | $4,268 | $317,300 | $75,800 | $241,500 |
| 2020 | $3,982 | $300,300 | $75,800 | $224,500 |
| 2019 | $3,833 | $288,400 | $71,000 | $217,400 |
| 2018 | $3,635 | $266,700 | $71,000 | $195,700 |
| 2017 | $3,412 | $253,700 | $71,000 | $182,700 |
| 2016 | $3,042 | $224,800 | $68,100 | $156,700 |
| 2015 | $2,938 | $224,800 | $68,100 | $156,700 |
| 2014 | $2,934 | $228,300 | $58,200 | $170,100 |
Source: Public Records
Map
Nearby Homes
- 233 Marion Rd
- 53 Starboard Dr Unit 36G
- 437 Main St
- 6 A Rock Marsh Rd Unit A
- 6 A Rock Marsh Rd Unit A
- 62 High St
- 0 Main St Unit 73450471
- 110 Mayflower Ridge Dr
- 21 Windsor Dr
- 5 Sola's Cir
- 4 Bachant Way
- 2596 Cranberry Hwy
- 45 Main St Unit 38
- 687 Main St
- 15 Broadmarsh Ave
- 4 Ross Ave
- 6 Allen Ave
- 722 Main St
- 20 Grant St
- 21 Weston Ave