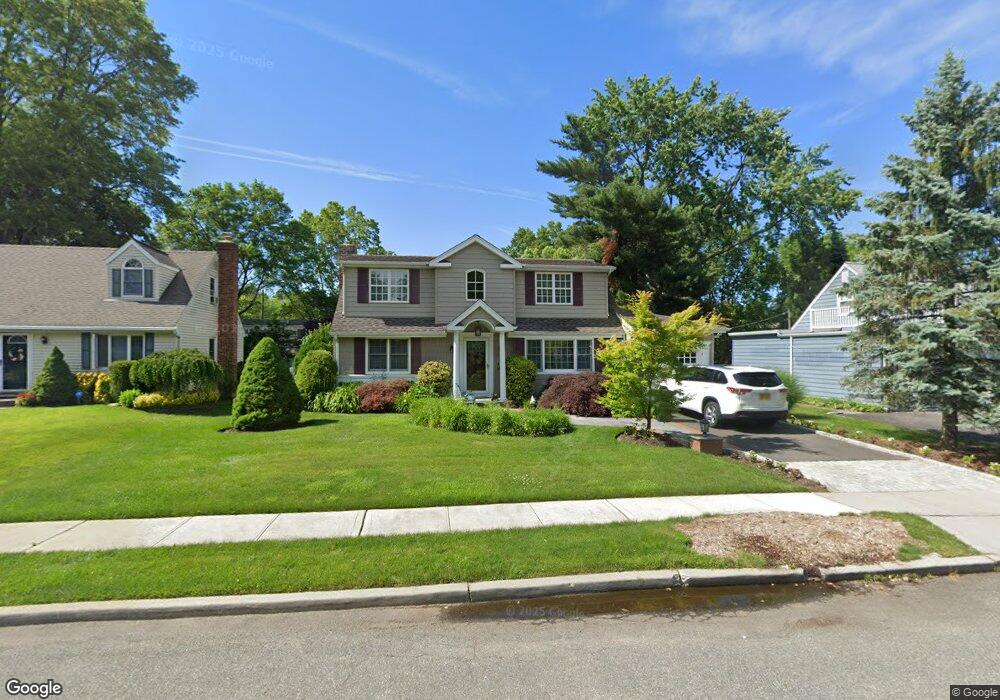
8 Greely Square Glen Head, NY 11545
Estimated Value: $811,000 - $861,354
--
Bed
2
Baths
1,842
Sq Ft
$454/Sq Ft
Est. Value
About This Home
This home is located at 8 Greely Square, Glen Head, NY 11545 and is currently estimated at $836,177, approximately $453 per square foot. 8 Greely Square is a home located in Nassau County with nearby schools including North Shore Middle School, North Shore Senior High School, and Tiegerman Elementary School.
Ownership History
Date
Name
Owned For
Owner Type
Purchase Details
Closed on
May 9, 2022
Sold by
Binninger William J and Binninger Anna
Bought by
Binninger Anna
Current Estimated Value
Home Financials for this Owner
Home Financials are based on the most recent Mortgage that was taken out on this home.
Original Mortgage
$366,000
Outstanding Balance
$304,606
Interest Rate
4.52%
Mortgage Type
New Conventional
Estimated Equity
$531,571
Purchase Details
Closed on
Jul 18, 1996
Sold by
Binninger William and Boglioli Anna
Bought by
Binninger William and Binninger Anna
Purchase Details
Closed on
Oct 3, 1995
Sold by
Aldred Ethel
Bought by
Binninger William and Boglioli Anna
Home Financials for this Owner
Home Financials are based on the most recent Mortgage that was taken out on this home.
Original Mortgage
$194,000
Interest Rate
7.71%
Create a Home Valuation Report for This Property
The Home Valuation Report is an in-depth analysis detailing your home's value as well as a comparison with similar homes in the area
Home Values in the Area
Average Home Value in this Area
Purchase History
| Date | Buyer | Sale Price | Title Company |
|---|---|---|---|
| Binninger Anna | $340,892 | Elite Abstract & Research Ll | |
| Binninger William | -- | -- | |
| Binninger William | $244,000 | -- |
Source: Public Records
Mortgage History
| Date | Status | Borrower | Loan Amount |
|---|---|---|---|
| Open | Binninger Anna | $366,000 | |
| Previous Owner | Binninger William | $194,000 |
Source: Public Records
Tax History Compared to Growth
Tax History
| Year | Tax Paid | Tax Assessment Tax Assessment Total Assessment is a certain percentage of the fair market value that is determined by local assessors to be the total taxable value of land and additions on the property. | Land | Improvement |
|---|---|---|---|---|
| 2025 | $15,611 | $651 | $215 | $436 |
| 2024 | $4,958 | $651 | $215 | $436 |
| 2023 | $15,564 | $651 | $215 | $436 |
| 2022 | $15,564 | $651 | $215 | $436 |
| 2021 | $15,465 | $645 | $213 | $432 |
| 2020 | $15,689 | $1,179 | $767 | $412 |
| 2019 | $15,419 | $1,179 | $767 | $412 |
| 2018 | $13,590 | $1,179 | $0 | $0 |
| 2017 | $7,806 | $1,179 | $767 | $412 |
| 2016 | $12,456 | $1,179 | $767 | $412 |
| 2015 | $4,119 | $1,179 | $767 | $412 |
| 2014 | $4,119 | $1,179 | $767 | $412 |
| 2013 | $3,693 | $1,179 | $767 | $412 |
Source: Public Records
Map
Nearby Homes
- 6 Greely Square
- 10 Greely Square
- 7 Washington Ave E
- 7 Washington Ave E
- 4 Greely Square
- 11 Greely Square
- 3 Washington Ave E
- 12 Greely Square
- 11 Washington Ave E
- 7 Greely Square
- 3 Greely Square
- 2 Greely Square
- 23 Radcliff Blvd
- 15 Greely Square
- 14 Greely Square
- 21 Radcliff Blvd
- 8 Washington Ave E
- 16 Greely Square
- 6 Washington Ave E
- 17 Greely Square