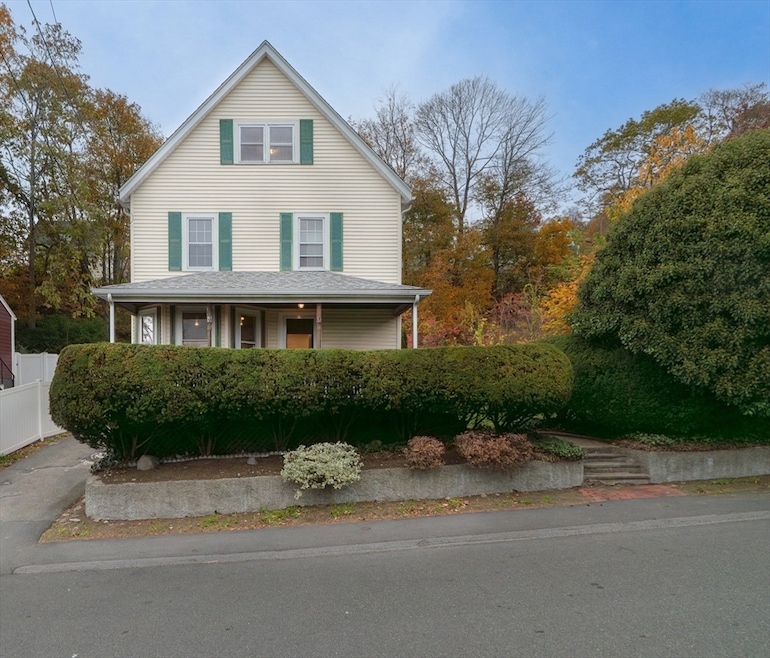
8 Hancock St Melrose, MA 02176
Melrose East Side NeighborhoodEstimated payment $4,104/month
Highlights
- Deck
- Property is near public transit
- Wood Flooring
- Lincoln Elementary School Rated A-
- Wooded Lot
- Attic
About This Home
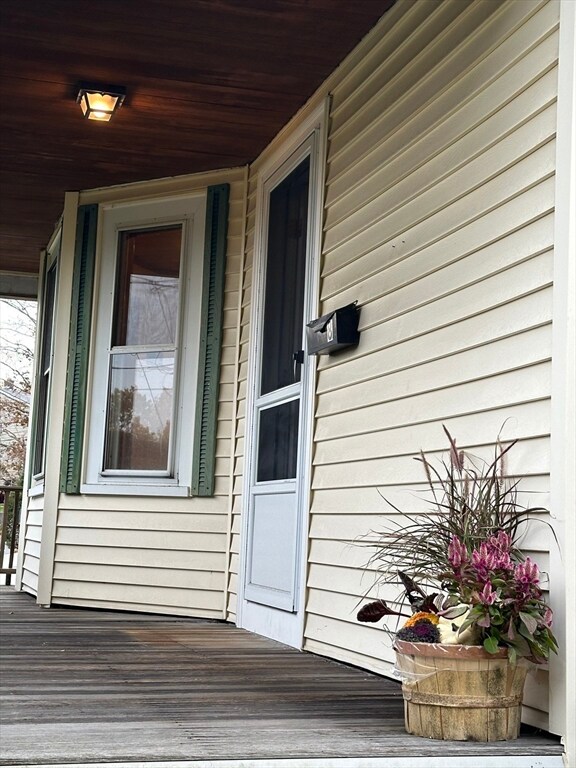
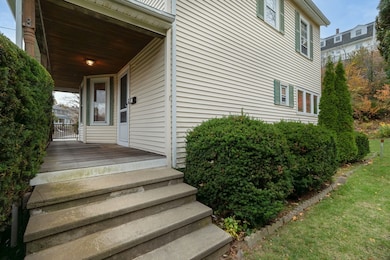
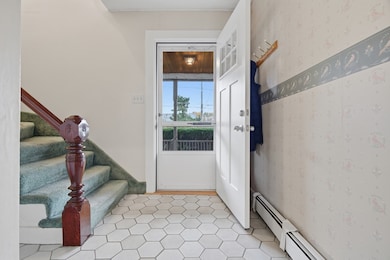
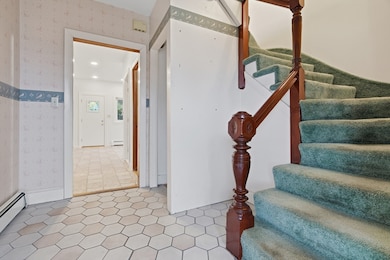
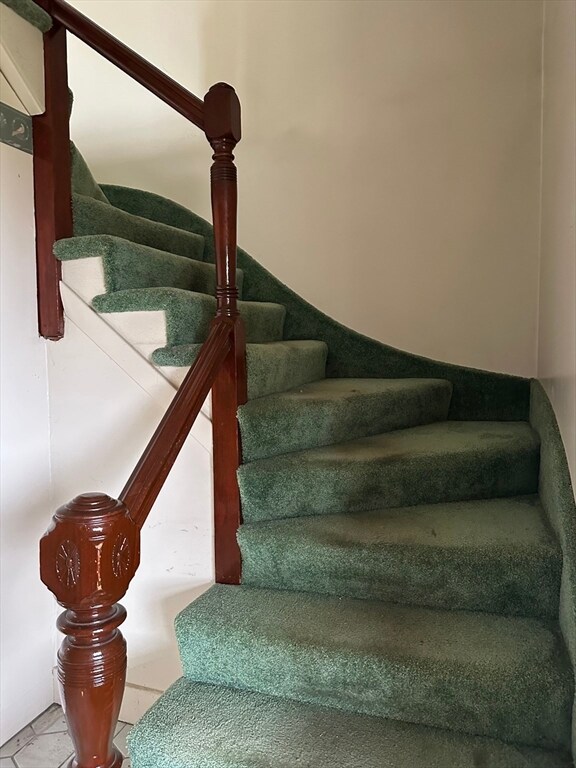
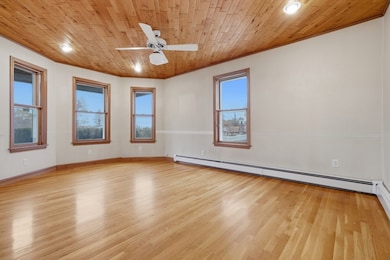
Old-Style much sought after single family residence in Melrose; 02176 ~ The Hoover-Ripley Neighborhood in the East Side of Melrose. This well loved family home for many years is awaiting updating and revamping. Welcoming foyer, front living room with hardwood flooring, wood slat ceiling and several large windows. Fully applianced kitchen with plenty of oak cabinetry and a dining area with many windows providing much natural light, overlooking a serene private yard. Big old stairway leading to the second floor where you'll find three bedrooms and a full bathroom as well as a walkup attic providing an additional floor (3rd floor) to be finished as a wonderful master suite, playroom or office area; the possibilities are endless! Full basement with laundry and interior and exterior access. Detached garage, driveway providing parking for several vehicles. Great opportunity to own this desirable property with its blend of classic appeal and modern potential, awaiting its next chapter!
Listing Agent
Berkshire Hathaway HomeServices Commonwealth Real Estate Listed on: 11/05/2025

Home Details
Home Type
- Single Family
Est. Annual Taxes
- $6,919
Year Built
- Built in 1900
Lot Details
- 7,601 Sq Ft Lot
- Gentle Sloping Lot
- Wooded Lot
- Property is zoned SRA
Parking
- 1 Car Detached Garage
- Driveway
- Open Parking
- Off-Street Parking
Home Design
- Stone Foundation
- Frame Construction
- Blown Fiberglass Insulation
- Blown-In Insulation
- Shingle Roof
Interior Spaces
- 1,520 Sq Ft Home
- Ceiling Fan
- Recessed Lighting
- Entrance Foyer
- Attic Access Panel
- Storm Doors
Kitchen
- Range
- Dishwasher
- Disposal
Flooring
- Wood
- Wall to Wall Carpet
- Concrete
- Ceramic Tile
- Vinyl
Bedrooms and Bathrooms
- 3 Bedrooms
- Primary bedroom located on second floor
- Pedestal Sink
- Bathtub with Shower
Laundry
- Dryer
- Washer
Unfinished Basement
- Walk-Out Basement
- Basement Fills Entire Space Under The House
- Interior Basement Entry
- Block Basement Construction
- Laundry in Basement
Eco-Friendly Details
- Energy-Efficient Thermostat
Outdoor Features
- Deck
- Porch
Location
- Property is near public transit
- Property is near schools
Schools
- Ripley Elementary School
- Melrose Veteran's Memorial Middle School
- Melrose High School
Utilities
- No Cooling
- 3 Heating Zones
- Heating System Uses Natural Gas
- Baseboard Heating
- 100 Amp Service
- Gas Water Heater
Listing and Financial Details
- Assessor Parcel Number 656326
Community Details
Overview
- No Home Owners Association
- Near Conservation Area
Amenities
- Shops
Map
Home Values in the Area
Average Home Value in this Area
Tax History
| Year | Tax Paid | Tax Assessment Tax Assessment Total Assessment is a certain percentage of the fair market value that is determined by local assessors to be the total taxable value of land and additions on the property. | Land | Improvement |
|---|---|---|---|---|
| 2025 | $69 | $698,900 | $430,600 | $268,300 |
| 2024 | $6,606 | $665,300 | $402,800 | $262,500 |
| 2023 | $6,467 | $620,600 | $375,000 | $245,600 |
| 2022 | $6,320 | $597,900 | $361,100 | $236,800 |
| 2021 | $6,204 | $566,600 | $347,300 | $219,300 |
| 2020 | $5,955 | $538,900 | $319,500 | $219,400 |
| 2019 | $5,486 | $507,500 | $305,600 | $201,900 |
| 2018 | $5,160 | $455,400 | $253,500 | $201,900 |
| 2017 | $5,027 | $426,000 | $243,100 | $182,900 |
| 2016 | $4,656 | $377,600 | $215,300 | $162,300 |
| 2015 | $4,739 | $365,700 | $215,300 | $150,400 |
| 2014 | $4,625 | $348,300 | $197,900 | $150,400 |
Property History
| Date | Event | Price | List to Sale | Price per Sq Ft |
|---|---|---|---|---|
| 11/11/2025 11/11/25 | Pending | -- | -- | -- |
| 11/05/2025 11/05/25 | For Sale | $669,900 | -- | $441 / Sq Ft |
Purchase History
| Date | Type | Sale Price | Title Company |
|---|---|---|---|
| Quit Claim Deed | -- | -- | |
| Deed | -- | -- |
Source: MLS Property Information Network (MLS PIN)
MLS Number: 73451880
APN: MELR-000003F-000000-000094-000095
Disclaimer: Certain information contained herein is derived from information provided by parties other than Homes.com. All information provided is deemed reliable, but is not guaranteed to be accurate and should be independently verified.
![]() The property listing data and information, or the Images, set forth herein were provided to MLS Property Information Network, Inc. from third party sources, including sellers, lessors and public records, and were compiled by MLS Property Information Network, Inc. The property listing data and information, and the Images, are for the personal, non-commercial use of consumers having a good faith interest in purchasing or leasing listed properties of the type displayed to them and may not be used for any purpose other than to identify prospective properties which such consumers may have a good faith interest in purchasing or leasing. MLS Property Information Network, Inc. and its subscribers disclaim any and all representations and warranties as to the accuracy of the property listing data and information, or as to the accuracy of any of the Images, set forth herein.
The property listing data and information, or the Images, set forth herein were provided to MLS Property Information Network, Inc. from third party sources, including sellers, lessors and public records, and were compiled by MLS Property Information Network, Inc. The property listing data and information, and the Images, are for the personal, non-commercial use of consumers having a good faith interest in purchasing or leasing listed properties of the type displayed to them and may not be used for any purpose other than to identify prospective properties which such consumers may have a good faith interest in purchasing or leasing. MLS Property Information Network, Inc. and its subscribers disclaim any and all representations and warranties as to the accuracy of the property listing data and information, or as to the accuracy of any of the Images, set forth herein.
- 31 Temple St
- 65 Beacon St
- 0 S Mountain Avenue & O Cargil
- 46 Lebanon St
- 188-190 Sylvan St
- 73 Lanark Rd
- 30 Wheeler Ave
- 139 Whitman Ave
- 0 Beech Ave
- 1 Mill Rd
- 10 Birch Ln
- 59 Dexter Rd
- 7 Sawyer Ct
- 149 Boston Rock Rd
- 366 Grove St
- 11 Larrabee St
- 26 Webber St Unit 1
- 35-35B Beachview Ave
- 58 Summer St
- 0 Beachview Ave