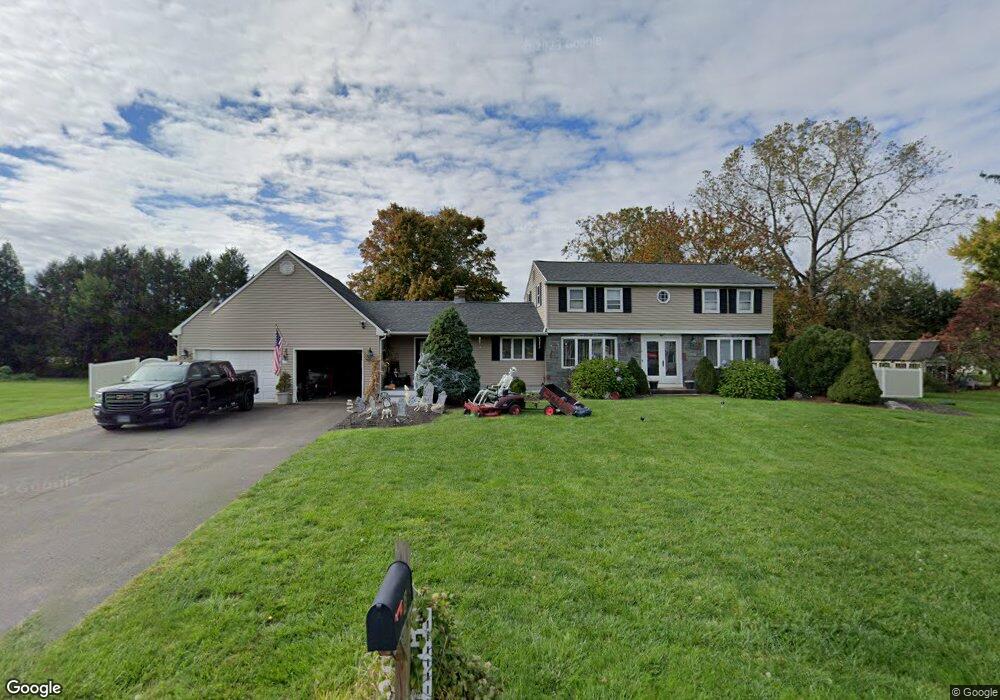
8 Hatheway Rd Ellington, CT 06029
Estimated Value: $475,000 - $539,000
4
Beds
7
Baths
2,170
Sq Ft
$236/Sq Ft
Est. Value
About This Home
This home is located at 8 Hatheway Rd, Ellington, CT 06029 and is currently estimated at $512,476, approximately $236 per square foot. 8 Hatheway Rd is a home located in Tolland County with nearby schools including Ellington High School.
Ownership History
Date
Name
Owned For
Owner Type
Purchase Details
Closed on
Dec 6, 2023
Sold by
Bauch Jolene
Bought by
Bauch Eric
Current Estimated Value
Home Financials for this Owner
Home Financials are based on the most recent Mortgage that was taken out on this home.
Original Mortgage
$284,000
Outstanding Balance
$278,684
Interest Rate
7.38%
Mortgage Type
Adjustable Rate Mortgage/ARM
Estimated Equity
$233,792
Purchase Details
Closed on
Jun 28, 2011
Sold by
Heffernan Jeremy R and Heffernan Kerri A
Bought by
Bauch Eric and Bauch Jolene
Home Financials for this Owner
Home Financials are based on the most recent Mortgage that was taken out on this home.
Original Mortgage
$265,104
Interest Rate
4.63%
Mortgage Type
Purchase Money Mortgage
Purchase Details
Closed on
Apr 27, 2007
Sold by
Sutton Elbridge and Sutton Darlene
Bought by
Heffernan Jeremy and Heffernan Keri
Create a Home Valuation Report for This Property
The Home Valuation Report is an in-depth analysis detailing your home's value as well as a comparison with similar homes in the area
Home Values in the Area
Average Home Value in this Area
Purchase History
| Date | Buyer | Sale Price | Title Company |
|---|---|---|---|
| Bauch Eric | -- | None Available | |
| Bauch Eric | -- | None Available | |
| Bauch Eric | $272,000 | -- | |
| Heffernan Jeremy | $302,500 | -- | |
| Bauch Eric | $272,000 | -- | |
| Heffernan Jeremy | $302,500 | -- |
Source: Public Records
Mortgage History
| Date | Status | Borrower | Loan Amount |
|---|---|---|---|
| Open | Bauch Eric | $284,000 | |
| Closed | Bauch Eric | $284,000 | |
| Previous Owner | Heffernan Jeremy | $265,104 |
Source: Public Records
Tax History
| Year | Tax Paid | Tax Assessment Tax Assessment Total Assessment is a certain percentage of the fair market value that is determined by local assessors to be the total taxable value of land and additions on the property. | Land | Improvement |
|---|---|---|---|---|
| 2025 | $7,942 | $214,070 | $59,760 | $154,310 |
| 2024 | $7,707 | $214,070 | $59,760 | $154,310 |
| 2023 | $7,343 | $214,070 | $59,760 | $154,310 |
| 2022 | $6,957 | $214,070 | $59,760 | $154,310 |
| 2021 | $6,765 | $214,070 | $59,760 | $154,310 |
| 2020 | $6,813 | $208,980 | $60,030 | $148,950 |
| 2019 | $6,813 | $208,980 | $60,030 | $148,950 |
| 2016 | $6,374 | $208,980 | $60,030 | $148,950 |
| 2015 | $6,374 | $208,980 | $60,030 | $148,950 |
| 2014 | $5,998 | $208,980 | $60,030 | $148,950 |
Source: Public Records
Map
Nearby Homes
- 96 Muddy Brook Rd
- 22 Sadds Mill Rd
- 9 Brockway Rd
- 3 Meagan Cir
- 58 Maple St
- 164 Pinney St
- 160 East Rd
- 164 East Rd
- 33 Lanz Ln
- 183 Chamberlain Rd
- 222 Mountain Rd
- 35 Highland Ave
- 77 Thrall Rd
- 0 Porter Rd
- 36 Ellridge Place
- 6 Setting Sun Trail
- 2 Setting Sun Trail
- 3 Standish Rd
- 56 Highland Ave
- 11 Settlers Way
Your Personal Tour Guide
Ask me questions while you tour the home.