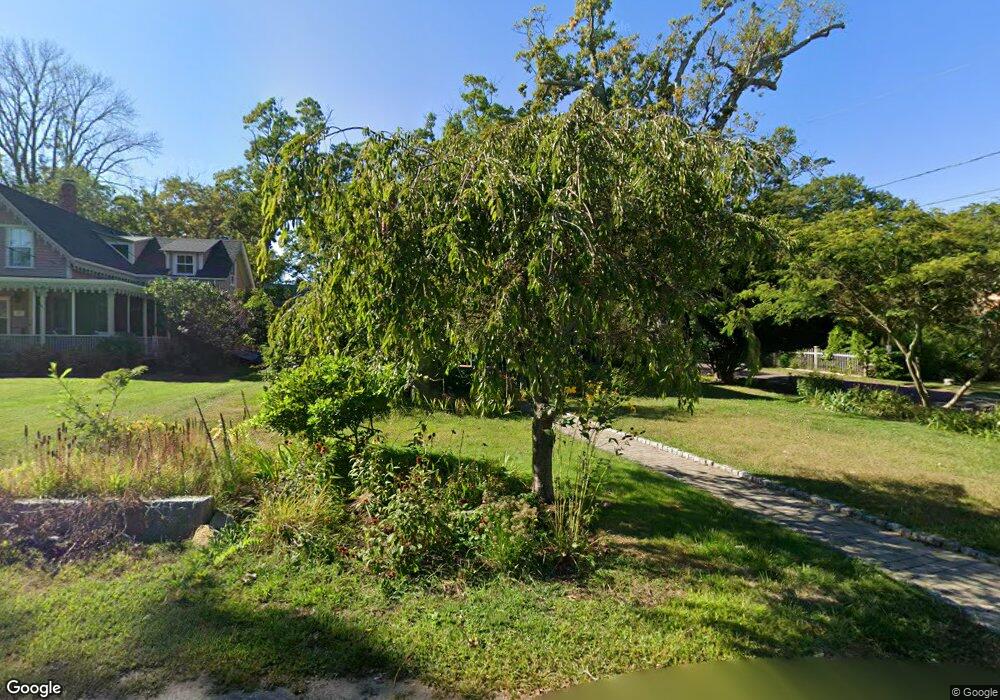
8 Haven Ave Rockport, MA 01966
Estimated Value: $662,559 - $854,000
3
Beds
2
Baths
1,008
Sq Ft
$781/Sq Ft
Est. Value
About This Home
This home is located at 8 Haven Ave, Rockport, MA 01966 and is currently estimated at $787,640, approximately $781 per square foot. 8 Haven Ave is a home located in Essex County with nearby schools including Rockport Elementary School, Rockport Middle School, and Rockport High School.
Ownership History
Date
Name
Owned For
Owner Type
Purchase Details
Closed on
Mar 16, 2011
Sold by
Block Ralph S and Block Margot H
Bought by
Grady James T and Grady Jeana H
Current Estimated Value
Home Financials for this Owner
Home Financials are based on the most recent Mortgage that was taken out on this home.
Original Mortgage
$279,770
Interest Rate
5.25%
Mortgage Type
FHA
Purchase Details
Closed on
Jul 16, 1999
Sold by
Donovan Daniel J and Donovan Audrey B
Bought by
Block Ralph S and Block Margot H
Home Financials for this Owner
Home Financials are based on the most recent Mortgage that was taken out on this home.
Original Mortgage
$125,000
Interest Rate
7.39%
Mortgage Type
Purchase Money Mortgage
Create a Home Valuation Report for This Property
The Home Valuation Report is an in-depth analysis detailing your home's value as well as a comparison with similar homes in the area
Home Values in the Area
Average Home Value in this Area
Purchase History
| Date | Buyer | Sale Price | Title Company |
|---|---|---|---|
| Grady James T | $310,000 | -- | |
| Grady James T | $310,000 | -- | |
| Block Ralph S | $189,900 | -- | |
| Block Ralph S | $189,900 | -- |
Source: Public Records
Mortgage History
| Date | Status | Borrower | Loan Amount |
|---|---|---|---|
| Open | Block Ralph S | $276,000 | |
| Closed | Grady James T | $279,770 | |
| Previous Owner | Block Ralph S | $15,000 | |
| Previous Owner | Block Ralph S | $125,000 |
Source: Public Records
Tax History
| Year | Tax Paid | Tax Assessment Tax Assessment Total Assessment is a certain percentage of the fair market value that is determined by local assessors to be the total taxable value of land and additions on the property. | Land | Improvement |
|---|---|---|---|---|
| 2025 | $4,949 | $565,000 | $326,800 | $238,200 |
| 2024 | $4,432 | $526,400 | $311,700 | $214,700 |
| 2023 | $4,618 | $489,700 | $288,200 | $201,500 |
| 2022 | $5,113 | $520,700 | $290,700 | $230,000 |
| 2021 | $4,830 | $495,900 | $276,800 | $219,100 |
| 2020 | $3,954 | $391,500 | $233,200 | $158,300 |
| 2019 | $3,802 | $385,600 | $227,300 | $158,300 |
| 2018 | $3,728 | $368,700 | $217,400 | $151,300 |
| 2017 | $3,513 | $311,400 | $197,200 | $114,200 |
| 2016 | $3,440 | $305,800 | $191,600 | $114,200 |
Source: Public Records
Map
Nearby Homes
- 13 Phillips Ave
- 32 Haven Ave
- 94 Phillips Ave
- 33 Quarry Ridge Ln Unit 33
- 10 Emerald St
- 5 Smith St Unit R
- 43 High St Unit B
- 1 Main St Unit R
- 1 Main St Unit C
- 4 Norwood Ave
- 1 Charte Ct
- 7 Colburn St
- 177 Main St
- 34R Summer St
- 27 Hodgkins Rd
- 16 Hodgkins Rd Unit 2
- 48 Eden Rd
- 33 Highview Rd
- 672 Washington St
- 175 South St
Your Personal Tour Guide
Ask me questions while you tour the home.