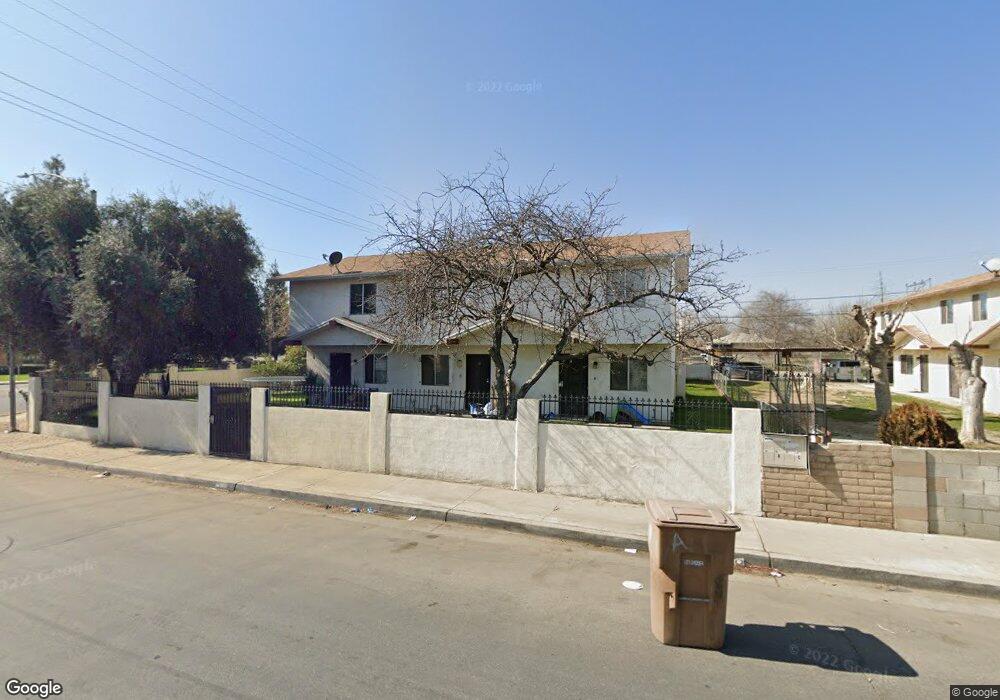
8 Hayes St Bakersfield, CA 93307
Lakeview NeighborhoodEstimated Value: $352,000 - $432,694
2
Beds
2
Baths
2,640
Sq Ft
$152/Sq Ft
Est. Value
About This Home
This home is located at 8 Hayes St, Bakersfield, CA 93307 and is currently estimated at $400,674, approximately $151 per square foot. 8 Hayes St is a home located in Kern County with nearby schools including Fremont Elementary School, Chipman Junior High School, and Mira Monte High School.
Ownership History
Date
Name
Owned For
Owner Type
Purchase Details
Closed on
Aug 9, 2006
Sold by
Mendoza Bernal Jose Manuel and Mendoza Ojeda Maria E
Bought by
Bernal Jose Manuel
Current Estimated Value
Purchase Details
Closed on
Mar 28, 2002
Sold by
Moreno Moreno Cuitlahuac Cuitlahuac and Moreno Nunez Maria Remedios
Bought by
Bernal Manuel
Home Financials for this Owner
Home Financials are based on the most recent Mortgage that was taken out on this home.
Original Mortgage
$128,189
Interest Rate
6.86%
Mortgage Type
FHA
Purchase Details
Closed on
Oct 11, 2000
Sold by
Plascencia Manuel S and Plascencia Ricarda
Bought by
Moreno Cuitlahuac
Purchase Details
Closed on
Nov 30, 1995
Sold by
Mcclanahan Melton and Mcclanahan Christina
Bought by
Plascencia Manuel S
Home Financials for this Owner
Home Financials are based on the most recent Mortgage that was taken out on this home.
Original Mortgage
$89,673
Interest Rate
7.36%
Mortgage Type
FHA
Create a Home Valuation Report for This Property
The Home Valuation Report is an in-depth analysis detailing your home's value as well as a comparison with similar homes in the area
Home Values in the Area
Average Home Value in this Area
Purchase History
| Date | Buyer | Sale Price | Title Company |
|---|---|---|---|
| Bernal Jose Manuel | -- | Ticor Title Company Of Ca | |
| Bernal Manuel | $130,000 | Chicago Title Co | |
| Moreno Cuitlahuac | -- | Chicago Title Co | |
| Plascencia Manuel S | $90,000 | Nations Title |
Source: Public Records
Mortgage History
| Date | Status | Borrower | Loan Amount |
|---|---|---|---|
| Previous Owner | Bernal Manuel | $128,189 | |
| Previous Owner | Plascencia Manuel S | $89,673 |
Source: Public Records
Tax History
| Year | Tax Paid | Tax Assessment Tax Assessment Total Assessment is a certain percentage of the fair market value that is determined by local assessors to be the total taxable value of land and additions on the property. | Land | Improvement |
|---|---|---|---|---|
| 2025 | $4,069 | $192,023 | $14,759 | $177,264 |
| 2024 | $4,069 | $188,259 | $14,470 | $173,789 |
| 2023 | $3,966 | $184,569 | $14,187 | $170,382 |
| 2022 | $3,839 | $180,951 | $13,909 | $167,042 |
| 2021 | $3,558 | $177,404 | $13,637 | $163,767 |
| 2020 | $3,458 | $175,586 | $13,498 | $162,088 |
| 2019 | $3,392 | $175,586 | $13,498 | $162,088 |
| 2018 | $3,321 | $168,770 | $12,975 | $155,795 |
| 2017 | $3,295 | $165,462 | $12,721 | $152,741 |
| 2016 | $3,079 | $162,219 | $12,472 | $149,747 |
| 2015 | $3,050 | $159,783 | $12,285 | $147,498 |
| 2014 | $2,558 | $121,120 | $21,120 | $100,000 |
Source: Public Records
Map
Nearby Homes
- 30 S Owens St
- 102 Northrup St
- 100 S Owens St
- 126 Clyde St
- 126 S Owens St
- 108 Augusta St
- 101 Clifton St
- 120 Clifton St
- 103 Clifton St
- 104 S Kincaid St
- 1001 Padre St
- 1012 Feliz Dr
- 122 Dr Martin l King jr Blvd
- 200 Clifton St
- 145 Kincaid St
- 921 Feliz Dr
- 0 Dr Martin Luther King jr Blvd Unit 202412301
- 137 S South King St
- 124 Madison St
- 931 Texas St
Your Personal Tour Guide
Ask me questions while you tour the home.