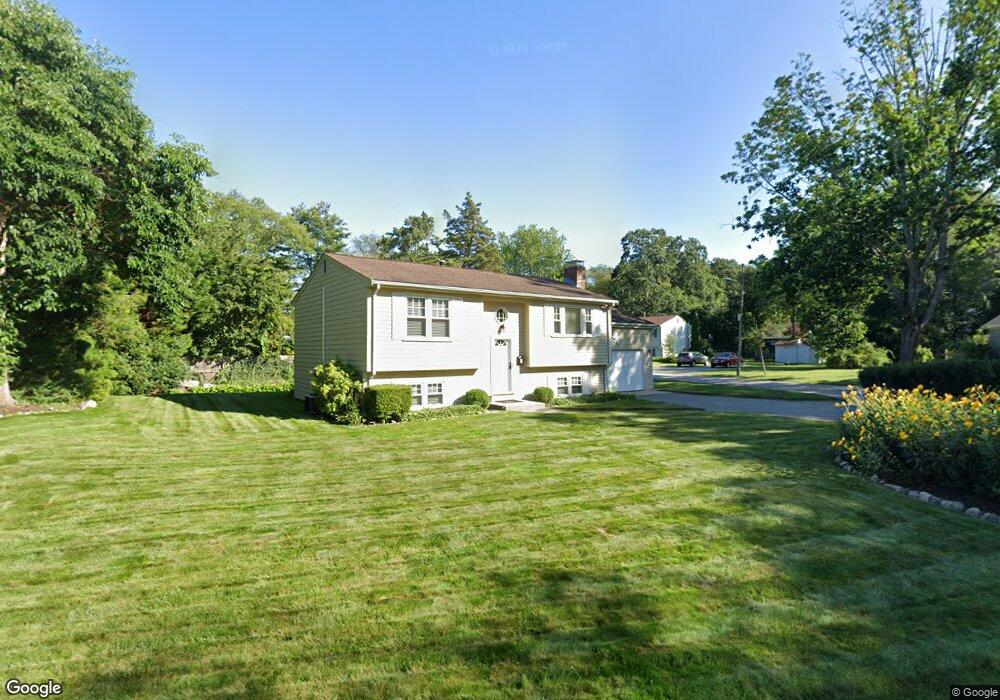
8 Hazelton Rd Barrington, RI 02806
North Barrington NeighborhoodEstimated Value: $530,630 - $544,000
2
Beds
1
Bath
878
Sq Ft
$611/Sq Ft
Est. Value
About This Home
This home is located at 8 Hazelton Rd, Barrington, RI 02806 and is currently estimated at $536,658, approximately $611 per square foot. 8 Hazelton Rd is a home located in Bristol County with nearby schools including Barrington High School, St Luke Elementary School, and Barrington Christian Academy.
Ownership History
Date
Name
Owned For
Owner Type
Purchase Details
Closed on
Jul 1, 1993
Sold by
Hunt William J and Hutn Alexandra
Bought by
Tomaselli Thomas and Tomaselli Mary
Current Estimated Value
Purchase Details
Closed on
Apr 19, 1991
Sold by
Carson Francis T
Bought by
Hunt William J
Create a Home Valuation Report for This Property
The Home Valuation Report is an in-depth analysis detailing your home's value as well as a comparison with similar homes in the area
Home Values in the Area
Average Home Value in this Area
Purchase History
| Date | Buyer | Sale Price | Title Company |
|---|---|---|---|
| Tomaselli Thomas | $120,500 | -- | |
| Tomaselli Thomas | $120,500 | -- | |
| Hunt William J | $122,000 | -- | |
| Hunt William J | $122,000 | -- |
Source: Public Records
Mortgage History
| Date | Status | Borrower | Loan Amount |
|---|---|---|---|
| Open | Hunt William J | $104,000 | |
| Open | Hunt William J | $167,000 |
Source: Public Records
Tax History Compared to Growth
Tax History
| Year | Tax Paid | Tax Assessment Tax Assessment Total Assessment is a certain percentage of the fair market value that is determined by local assessors to be the total taxable value of land and additions on the property. | Land | Improvement |
|---|---|---|---|---|
| 2025 | $8,192 | $534,000 | $264,000 | $270,000 |
| 2024 | $7,877 | $534,000 | $264,000 | $270,000 |
| 2023 | $7,125 | $351,000 | $147,000 | $204,000 |
| 2022 | $6,897 | $351,000 | $147,000 | $204,000 |
| 2021 | $6,722 | $351,000 | $147,000 | $204,000 |
| 2020 | $6,249 | $299,000 | $124,000 | $175,000 |
| 2019 | $6,010 | $299,000 | $124,000 | $175,000 |
| 2018 | $5,831 | $299,000 | $124,000 | $175,000 |
| 2017 | $5,598 | $279,900 | $123,100 | $156,800 |
| 2016 | $5,164 | $279,900 | $123,100 | $156,800 |
| 2015 | $5,108 | $279,900 | $123,100 | $156,800 |
| 2014 | $5,386 | $294,300 | $125,600 | $168,700 |
Source: Public Records
Map
Nearby Homes
- 6 Hazelton Rd
- 6 Kenmore Ct
- 46 Tanglewood Dr
- 22 Mayfield Rd
- 6 Hilton Ave
- 27 Rosedale Ave
- 85 Hilton Ave
- 146 Becker Ave
- 45 Washington Rd
- 7 Jill Ct
- 140 Promenade St
- 16 Highview Ave
- 25 Winslow St
- 36 Woodbine St
- 25 Woodbine St
- 735 Willett Ave Unit 806
- 81 Pine Crest Dr
- 83 Pine Crest Dr
- 536 Willett Ave
- 5 Booth Ave