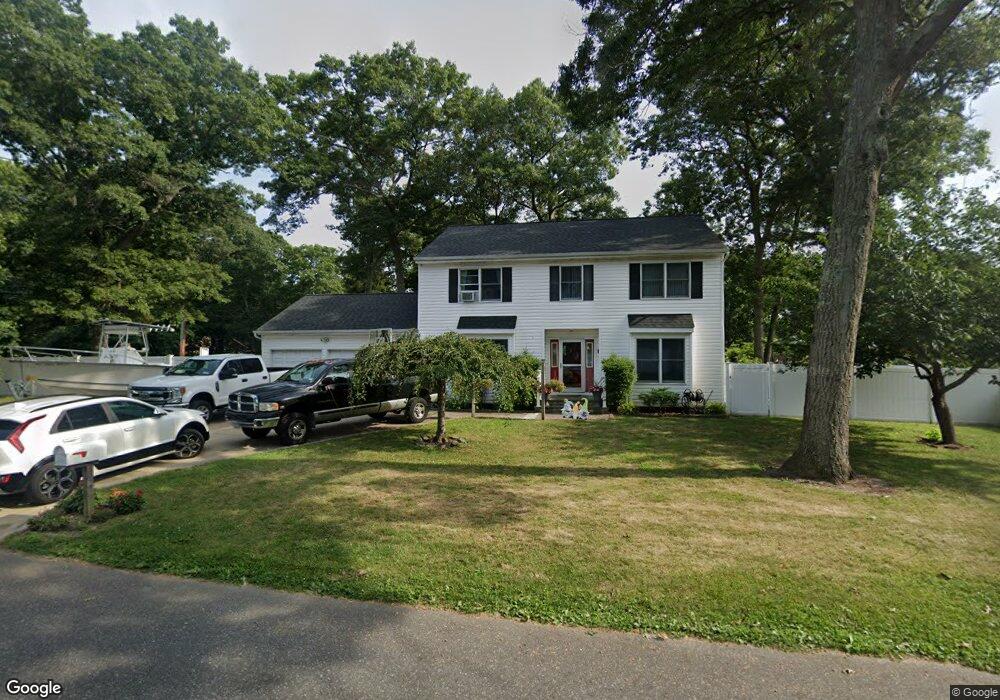
8 Hemlock St Selden, NY 11784
Estimated Value: $680,000 - $713,000
4
Beds
3
Baths
2,340
Sq Ft
$298/Sq Ft
Est. Value
About This Home
This home is located at 8 Hemlock St, Selden, NY 11784 and is currently estimated at $697,650, approximately $298 per square foot. 8 Hemlock St is a home located in Suffolk County.
Ownership History
Date
Name
Owned For
Owner Type
Purchase Details
Closed on
Jan 24, 2015
Sold by
Astoria Bank and Astoria Federal Savings And Loan Associa
Bought by
Bedus Christopher and Bedus Amanda
Current Estimated Value
Home Financials for this Owner
Home Financials are based on the most recent Mortgage that was taken out on this home.
Original Mortgage
$313,712
Outstanding Balance
$240,555
Interest Rate
3.87%
Mortgage Type
FHA
Estimated Equity
$457,095
Purchase Details
Closed on
Mar 20, 2014
Sold by
Schwartzer Richard and Davis Winston
Bought by
Astoria Federal Savings And Loan Associa
Purchase Details
Closed on
Nov 4, 2004
Sold by
Palhares Antonio C and Palhares Rosa
Bought by
David Winston
Purchase Details
Closed on
Aug 17, 1995
Sold by
Palhares Antonio
Bought by
Palhares Antonio C and Palhares Rosa
Create a Home Valuation Report for This Property
The Home Valuation Report is an in-depth analysis detailing your home's value as well as a comparison with similar homes in the area
Home Values in the Area
Average Home Value in this Area
Purchase History
| Date | Buyer | Sale Price | Title Company |
|---|---|---|---|
| Bedus Christopher | $319,500 | Core Title Services Inc | |
| Astoria Federal Savings And Loan Associa | $607,242 | Coach Title Insurance | |
| David Winston | $475,000 | John Shea | |
| Palhares Antonio C | $165,000 | Stewart Title Insurance Co |
Source: Public Records
Mortgage History
| Date | Status | Borrower | Loan Amount |
|---|---|---|---|
| Open | Bedus Christopher | $313,712 | |
| Closed | Astoria Federal Savings And Loan Associa | $0 |
Source: Public Records
Tax History
| Year | Tax Paid | Tax Assessment Tax Assessment Total Assessment is a certain percentage of the fair market value that is determined by local assessors to be the total taxable value of land and additions on the property. | Land | Improvement |
|---|---|---|---|---|
| 2024 | $11,175 | $3,024 | $200 | $2,824 |
| 2023 | $11,175 | $3,024 | $200 | $2,824 |
| 2022 | $9,947 | $3,024 | $200 | $2,824 |
| 2021 | $9,947 | $3,024 | $200 | $2,824 |
| 2020 | $10,200 | $3,024 | $200 | $2,824 |
| 2019 | $10,200 | $0 | $0 | $0 |
| 2018 | $9,721 | $3,024 | $200 | $2,824 |
| 2017 | $9,721 | $3,024 | $200 | $2,824 |
| 2016 | $9,696 | $3,024 | $200 | $2,824 |
| 2015 | -- | $3,024 | $200 | $2,824 |
| 2014 | -- | $3,024 | $200 | $2,824 |
Source: Public Records
Map
Nearby Homes
Your Personal Tour Guide
Ask me questions while you tour the home.