
Landlord's Agent in 2020
Mollie Ruffner
Ruffner Real Estate, LLC
(603) 770-6840
52 in this area
95 Total Sales

Estimated Value: $572,253 - $715,000
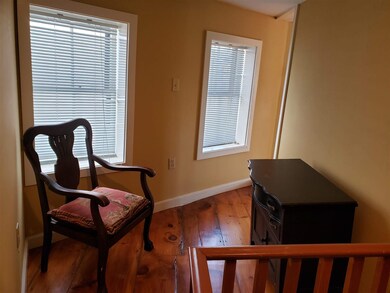
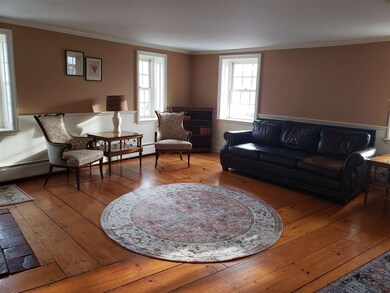
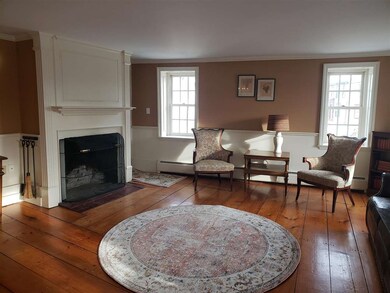
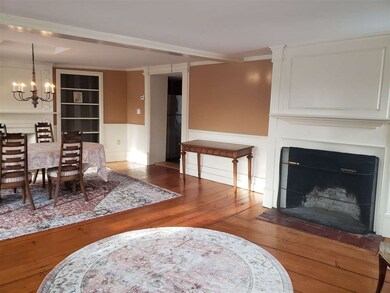
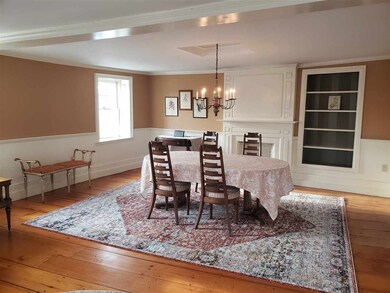
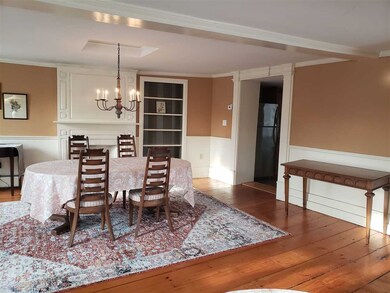
One of a kind executive rental situated in the center of Downtown Exeter. This historic property is fully furnished and move-in ready for easy downtown living, but can also be offered unfurnished as well. The home is just over 1,900 square feet and features 2 bedrooms, spacious living and dining room with wide pine floors and fully applianced kitchen. Walk to everything that downtown has to offer; library, parks, restaurants, shopping, Phillips Exeter Academy, Amtrak train and more. Tenant responsible for the cost of natural gas heat, electricity and water/sewer. Tenant is responsible for snow removal on the stairs. Flexible lease term options available. Pets negotiable, no smoking. Credit and background checks required. The garage and street level office space are NOT included in the rental.
Last Agent to Rent the Property
Ruffner Real Estate, LLC Brokerage Email: mollie@ruffner-re.com License #062890 Listed on: 01/16/2020
Last Renter's Agent
Ruffner Real Estate, LLC Brokerage Email: mollie@ruffner-re.com License #062890 Listed on: 01/16/2020
| Date | Buyer | Sale Price | Title Company |
|---|---|---|---|
| Willard | $410,000 | None Available | |
| Willard-Mcphee Cory | $410,000 | None Available | |
| Colling Gregory | $325,300 | -- | |
| Colling Gregory | $325,300 | -- |
| Date | Status | Borrower | Loan Amount |
|---|---|---|---|
| Open | Willard-Mcphee Cory | $369,000 | |
| Closed | Willard-Mcphee Cory | $369,000 | |
| Closed | Colling Gregory | $0 |
| Date | Event | Price | List to Sale | Price per Sq Ft | Prior Sale |
|---|---|---|---|---|---|
| 03/09/2020 03/09/20 | Rented | $1,800 | 0.0% | -- | |
| 02/05/2020 02/05/20 | Price Changed | $1,800 | -10.0% | $1 / Sq Ft | |
| 01/27/2020 01/27/20 | Price Changed | $2,000 | -16.7% | $1 / Sq Ft | |
| 01/16/2020 01/16/20 | For Rent | $2,400 | 0.0% | -- | |
| 01/10/2020 01/10/20 | Sold | $410,000 | -1.2% | $207 / Sq Ft | View Prior Sale |
| 11/14/2019 11/14/19 | Pending | -- | -- | -- | |
| 10/10/2019 10/10/19 | Price Changed | $415,000 | -2.4% | $209 / Sq Ft | |
| 09/16/2019 09/16/19 | For Sale | $425,000 | +36.2% | $214 / Sq Ft | |
| 08/07/2014 08/07/14 | Sold | $312,000 | -2.2% | $116 / Sq Ft | View Prior Sale |
| 06/04/2014 06/04/14 | Pending | -- | -- | -- | |
| 11/04/2013 11/04/13 | For Sale | $319,000 | -- | $119 / Sq Ft |
| Year | Tax Paid | Tax Assessment Tax Assessment Total Assessment is a certain percentage of the fair market value that is determined by local assessors to be the total taxable value of land and additions on the property. | Land | Improvement |
|---|---|---|---|---|
| 2025 | $9,100 | $485,100 | $88,000 | $397,100 |
| 2024 | $8,630 | $485,100 | $88,000 | $397,100 |
| 2023 | $8,580 | $320,400 | $51,700 | $268,700 |
| 2022 | $7,930 | $320,400 | $51,700 | $268,700 |
| 2021 | $7,693 | $320,400 | $51,700 | $268,700 |
| 2020 | $7,847 | $320,400 | $51,700 | $268,700 |
| 2019 | $7,456 | $320,400 | $51,700 | $268,700 |
| 2018 | $7,662 | $278,600 | $24,700 | $253,900 |
| 2017 | $7,458 | $278,600 | $24,700 | $253,900 |
| 2016 | $7,310 | $278,600 | $24,700 | $253,900 |
| 2015 | $7,488 | $293,200 | $39,300 | $253,900 |
| 2014 | $6,273 | $240,700 | $33,600 | $207,100 |
| 2013 | $6,265 | $240,700 | $33,600 | $207,100 |
| 2011 | $6,085 | $240,700 | $33,600 | $207,100 |
Landlord's Agent in 2020
Mollie Ruffner
Ruffner Real Estate, LLC
(603) 770-6840
52 in this area
95 Total Sales
Seller's Agent in 2020
Kathy Corson
Duston Leddy Real Estate
(603) 686-9600
26 in this area
52 Total Sales
Seller's Agent in 2014
Betty LaBranche
Betty LaBranche Real Estate, Inc.
(603) 828-3986
9 in this area
26 Total Sales
Source: PrimeMLS
MLS Number: 4790539
APN: EXTR-000072-000000-000057
Disclaimer: Certain information contained herein is derived from information provided by parties other than Homes.com. All information provided is deemed reliable, but is not guaranteed to be accurate and should be independently verified.
![]() Copyright 2026 PrimeMLS, Inc. All rights reserved. This information is deemed reliable, but not guaranteed. The data relating to real estate displayed on this display comes in part from the IDX Program of PrimeMLS. The information being provided is for consumers’ personal, non-commercial use and may not be used for any purpose other than to identify prospective properties consumers may be interested in purchasing.
Copyright 2026 PrimeMLS, Inc. All rights reserved. This information is deemed reliable, but not guaranteed. The data relating to real estate displayed on this display comes in part from the IDX Program of PrimeMLS. The information being provided is for consumers’ personal, non-commercial use and may not be used for any purpose other than to identify prospective properties consumers may be interested in purchasing.
Ask me questions while you tour the home.