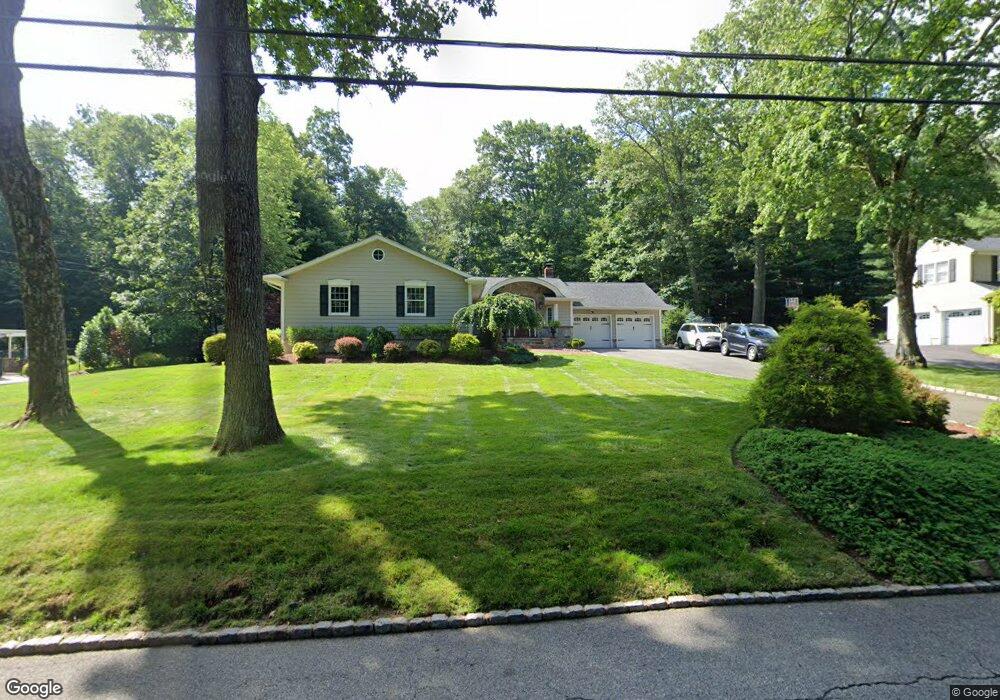
8 Hillcrest Dr Randolph, NJ 07869
Estimated Value: $807,000 - $877,000
Studio
--
Bath
2,135
Sq Ft
$395/Sq Ft
Est. Value
About This Home
This home is located at 8 Hillcrest Dr, Randolph, NJ 07869 and is currently estimated at $842,804, approximately $394 per square foot. 8 Hillcrest Dr is a home located in Morris County with nearby schools including Randolph High School, Randolph Middle School, and Apple Montessori Schools and Camps - Randolph.
Ownership History
Date
Name
Owned For
Owner Type
Purchase Details
Closed on
Jan 20, 2018
Sold by
Kosenbergen Edward John and Benedetto Jennifer Di
Bought by
Rosenbergen Edward John and Rosenbergen Jennifer
Current Estimated Value
Home Financials for this Owner
Home Financials are based on the most recent Mortgage that was taken out on this home.
Original Mortgage
$268,952
Outstanding Balance
$189,753
Interest Rate
3.93%
Mortgage Type
New Conventional
Estimated Equity
$653,051
Purchase Details
Closed on
Sep 23, 1995
Sold by
Christofferson Richard L and Christofferson Joanne M Killinger
Bought by
Rosenbergen Edward John and Dibenedetto Jennifer
Create a Home Valuation Report for This Property
The Home Valuation Report is an in-depth analysis detailing your home's value as well as a comparison with similar homes in the area
Home Values in the Area
Average Home Value in this Area
Purchase History
| Date | Buyer | Sale Price | Title Company |
|---|---|---|---|
| Rosenbergen Edward John | -- | Service Link | |
| Rosenbergen Edward John | $240,000 | -- |
Source: Public Records
Mortgage History
| Date | Status | Borrower | Loan Amount |
|---|---|---|---|
| Open | Rosenbergen Edward John | $268,952 |
Source: Public Records
Tax History
| Year | Tax Paid | Tax Assessment Tax Assessment Total Assessment is a certain percentage of the fair market value that is determined by local assessors to be the total taxable value of land and additions on the property. | Land | Improvement |
|---|---|---|---|---|
| 2025 | $15,505 | $547,700 | $244,600 | $303,100 |
| 2024 | $15,117 | $547,700 | $244,600 | $303,100 |
Source: Public Records
Map
Nearby Homes
Your Personal Tour Guide
Ask me questions while you tour the home.