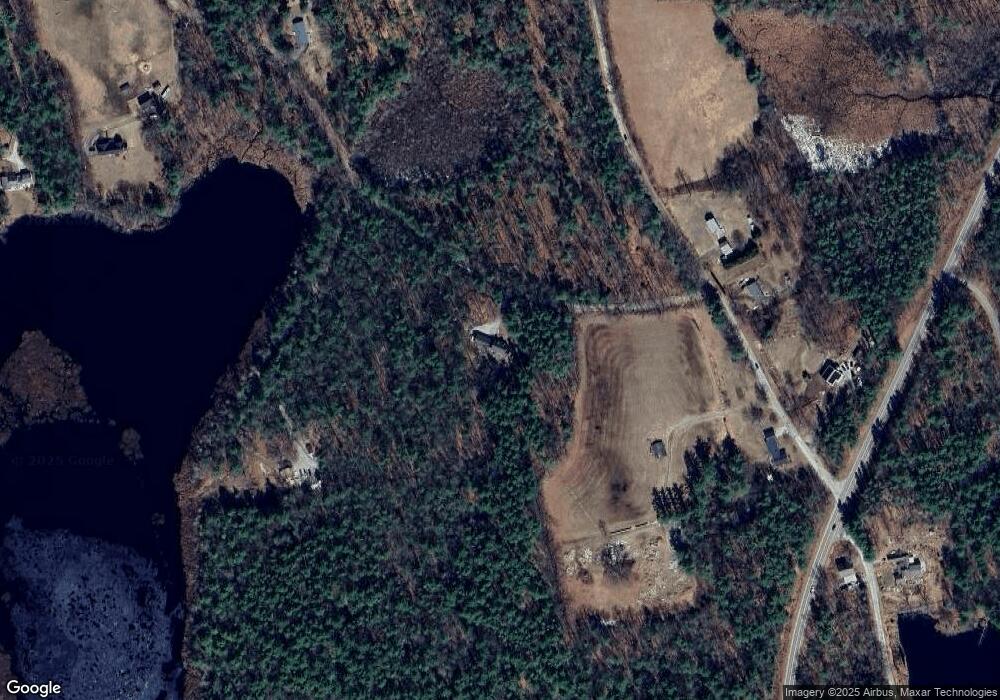
8 Horton Rd Mont Vernon, NH 03057
Estimated Value: $637,000 - $713,000
2
Beds
3
Baths
1,862
Sq Ft
$363/Sq Ft
Est. Value
About This Home
This home is located at 8 Horton Rd, Mont Vernon, NH 03057 and is currently estimated at $676,316, approximately $363 per square foot. 8 Horton Rd is a home with nearby schools including Mont Vernon Village School and Souhegan Cooperative High School.
Ownership History
Date
Name
Owned For
Owner Type
Purchase Details
Closed on
Mar 11, 2020
Sold by
Osullivan Daniel P
Bought by
D P & K K Osullivan Ret
Current Estimated Value
Purchase Details
Closed on
Jul 6, 2005
Sold by
Ryder Eric D and Ryder Laura
Bought by
Osullivan Daniel P
Home Financials for this Owner
Home Financials are based on the most recent Mortgage that was taken out on this home.
Original Mortgage
$272,400
Interest Rate
5.71%
Mortgage Type
Purchase Money Mortgage
Create a Home Valuation Report for This Property
The Home Valuation Report is an in-depth analysis detailing your home's value as well as a comparison with similar homes in the area
Home Values in the Area
Average Home Value in this Area
Purchase History
| Date | Buyer | Sale Price | Title Company |
|---|---|---|---|
| D P & K K Osullivan Ret | -- | None Available | |
| Osullivan Daniel P | $340,500 | -- |
Source: Public Records
Mortgage History
| Date | Status | Borrower | Loan Amount |
|---|---|---|---|
| Previous Owner | Osullivan Daniel P | $235,000 | |
| Previous Owner | Osullivan Daniel P | $272,400 |
Source: Public Records
Tax History Compared to Growth
Tax History
| Year | Tax Paid | Tax Assessment Tax Assessment Total Assessment is a certain percentage of the fair market value that is determined by local assessors to be the total taxable value of land and additions on the property. | Land | Improvement |
|---|---|---|---|---|
| 2024 | $11,412 | $577,519 | $146,999 | $430,520 |
| 2023 | $9,792 | $337,201 | $93,611 | $243,590 |
| 2022 | $9,453 | $337,256 | $93,666 | $243,590 |
| 2021 | $8,901 | $312,963 | $93,773 | $219,190 |
| 2020 | $8,319 | $312,980 | $93,790 | $219,190 |
| 2019 | $8,008 | $310,139 | $93,799 | $216,340 |
| 2018 | $7,940 | $260,997 | $88,727 | $172,270 |
| 2016 | $7,671 | $260,490 | $88,670 | $171,820 |
| 2015 | $7,670 | $260,437 | $88,617 | $171,820 |
| 2014 | $6,535 | $264,040 | $98,720 | $165,320 |
| 2013 | $7,248 | $264,040 | $98,720 | $165,320 |
Source: Public Records
Map
Nearby Homes