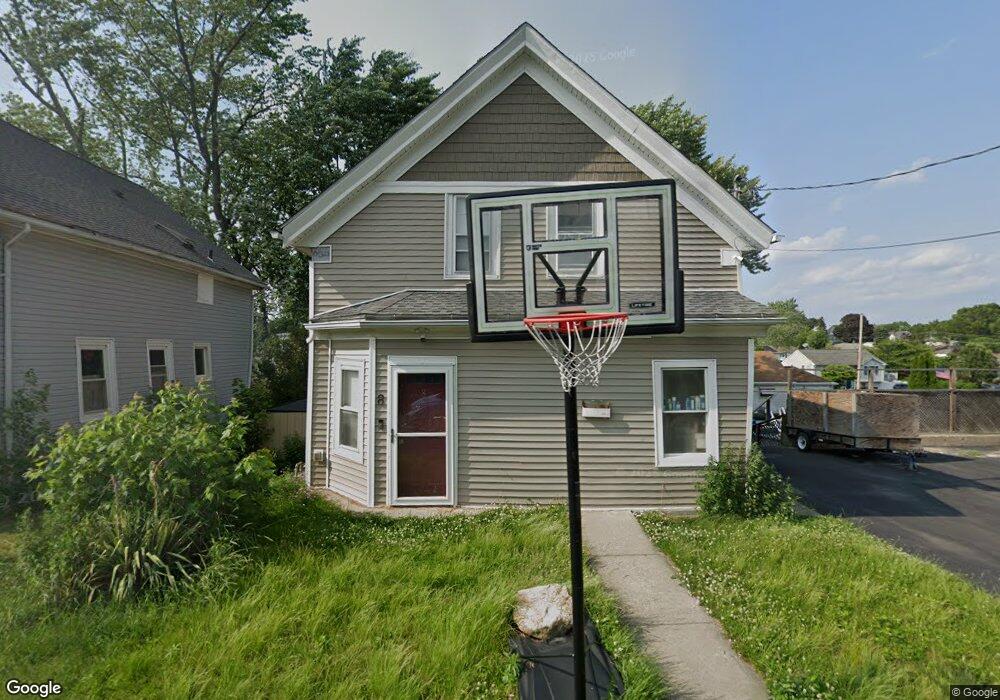
8 Irving St Cranston, RI 02910
Spectacle NeighborhoodEstimated Value: $358,000 - $373,000
4
Beds
2
Baths
1,054
Sq Ft
$345/Sq Ft
Est. Value
About This Home
This home is located at 8 Irving St, Cranston, RI 02910 and is currently estimated at $364,082, approximately $345 per square foot. 8 Irving St is a home located in Providence County with nearby schools including Stadium Elementary School, Hugh B. Bain Middle School, and Cranston High School East.
Ownership History
Date
Name
Owned For
Owner Type
Purchase Details
Closed on
Dec 7, 2016
Sold by
Hartmann Alice M and Rice Sheena L
Bought by
Hartman Sheena L and Hartman Jason
Current Estimated Value
Purchase Details
Closed on
Apr 7, 2011
Sold by
Hartmann Alice M and Price Sheena L
Bought by
Hartmann Alice M and Collins Barbara S
Purchase Details
Closed on
Jan 7, 2011
Sold by
Bidpro Llc
Bought by
Hartman Alice M and Rice Sheena L
Home Financials for this Owner
Home Financials are based on the most recent Mortgage that was taken out on this home.
Original Mortgage
$140,229
Interest Rate
4.62%
Mortgage Type
FHA
Purchase Details
Closed on
Jun 9, 2010
Sold by
Deutsche Bank Natl T C
Bought by
Sdh Consulting Llc and Bidpro Llc
Purchase Details
Closed on
Oct 8, 2003
Sold by
Katalin Kasardi Z
Bought by
Broccoli Freddy and Broccoli Stephanie
Create a Home Valuation Report for This Property
The Home Valuation Report is an in-depth analysis detailing your home's value as well as a comparison with similar homes in the area
Home Values in the Area
Average Home Value in this Area
Purchase History
| Date | Buyer | Sale Price | Title Company |
|---|---|---|---|
| Hartman Sheena L | -- | -- | |
| Hartmann Alice M | -- | -- | |
| Hartman Alice M | $132,000 | -- | |
| Sdh Consulting Llc | $95,500 | -- | |
| Broccoli Freddy | $174,000 | -- |
Source: Public Records
Mortgage History
| Date | Status | Borrower | Loan Amount |
|---|---|---|---|
| Previous Owner | Broccoli Freddy | $140,229 | |
| Previous Owner | Broccoli Freddy | $200,000 |
Source: Public Records
Tax History Compared to Growth
Tax History
| Year | Tax Paid | Tax Assessment Tax Assessment Total Assessment is a certain percentage of the fair market value that is determined by local assessors to be the total taxable value of land and additions on the property. | Land | Improvement |
|---|---|---|---|---|
| 2025 | $3,904 | $281,300 | $92,100 | $189,200 |
| 2024 | $3,828 | $281,300 | $92,100 | $189,200 |
| 2023 | $3,576 | $189,200 | $63,500 | $125,700 |
| 2022 | $3,502 | $189,200 | $63,500 | $125,700 |
| 2021 | $3,406 | $189,200 | $63,500 | $125,700 |
| 2020 | $3,323 | $160,000 | $60,300 | $99,700 |
| 2019 | $3,323 | $160,000 | $60,300 | $99,700 |
| 2018 | $3,246 | $160,000 | $60,300 | $99,700 |
| 2017 | $2,906 | $126,700 | $44,500 | $82,200 |
| 2016 | $2,844 | $126,700 | $44,500 | $82,200 |
Source: Public Records
Map
Nearby Homes