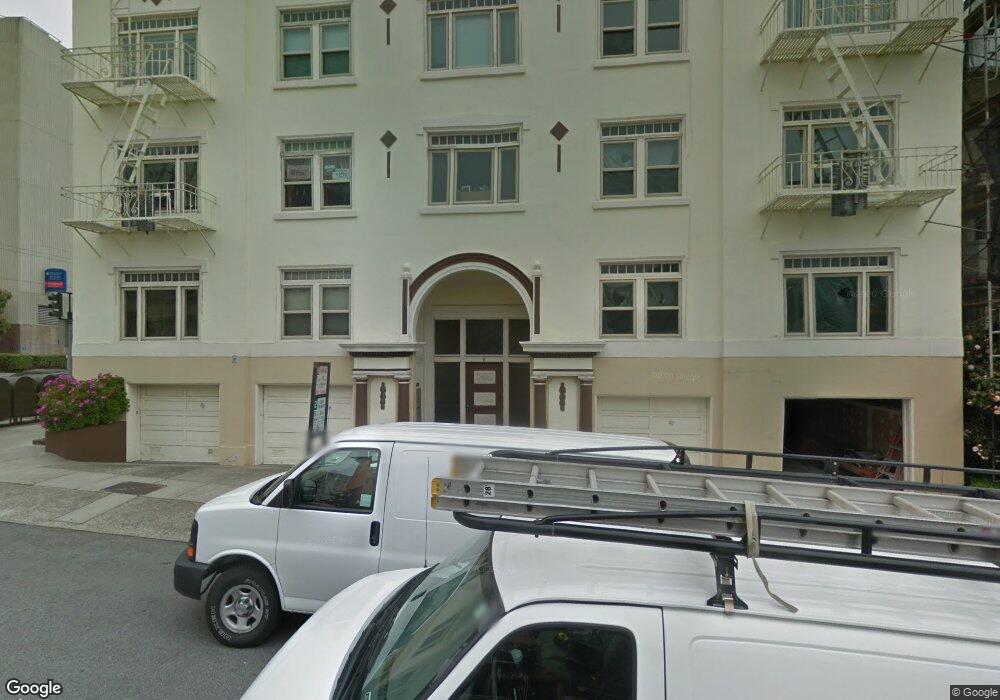
8 Jordan Ave Unit 8 San Francisco, CA 94118
Jordan Park/Laurel Heights NeighborhoodEstimated Value: $778,000 - $1,052,000
1
Bed
1
Bath
815
Sq Ft
$1,079/Sq Ft
Est. Value
About This Home
This home is located at 8 Jordan Ave Unit 8, San Francisco, CA 94118 and is currently estimated at $879,234, approximately $1,078 per square foot. 8 Jordan Ave Unit 8 is a home located in San Francisco County with nearby schools including George Peabody Elementary, Roosevelt Middle School, and Presidio Hill School.
Ownership History
Date
Name
Owned For
Owner Type
Purchase Details
Closed on
Feb 22, 2018
Sold by
Connor Shirley O and Aueribach Stephanie
Bought by
Allen Patrick William and Puncke Megan Kelly
Current Estimated Value
Home Financials for this Owner
Home Financials are based on the most recent Mortgage that was taken out on this home.
Original Mortgage
$600,000
Outstanding Balance
$508,146
Interest Rate
3.99%
Mortgage Type
New Conventional
Estimated Equity
$371,088
Purchase Details
Closed on
Jul 19, 2017
Sold by
Auerbach Lee
Bought by
Auerbach Stephanie
Home Financials for this Owner
Home Financials are based on the most recent Mortgage that was taken out on this home.
Original Mortgage
$60,000
Interest Rate
3.91%
Mortgage Type
Purchase Money Mortgage
Purchase Details
Closed on
Jan 14, 2013
Sold by
Blasko Peter and Mark Lester 1981 Revocable Tru
Bought by
Oconnor Shirley and Auerbach Stephanie
Create a Home Valuation Report for This Property
The Home Valuation Report is an in-depth analysis detailing your home's value as well as a comparison with similar homes in the area
Home Values in the Area
Average Home Value in this Area
Purchase History
| Date | Buyer | Sale Price | Title Company |
|---|---|---|---|
| Allen Patrick William | $750,000 | Old Republic Title Co | |
| Auerbach Stephanie | -- | Old Republic Title Company | |
| Connor Shirley O | -- | Old Republic Title Company | |
| Oconnor Shirley | -- | Old Republic Title |
Source: Public Records
Mortgage History
| Date | Status | Borrower | Loan Amount |
|---|---|---|---|
| Open | Allen Patrick William | $600,000 | |
| Previous Owner | Connor Shirley O | $60,000 |
Source: Public Records
Tax History Compared to Growth
Tax History
| Year | Tax Paid | Tax Assessment Tax Assessment Total Assessment is a certain percentage of the fair market value that is determined by local assessors to be the total taxable value of land and additions on the property. | Land | Improvement |
|---|---|---|---|---|
| 2025 | $10,590 | $853,360 | $512,018 | $341,342 |
| 2024 | $10,590 | $836,630 | $501,980 | $334,650 |
| 2023 | $10,426 | $820,228 | $492,138 | $328,090 |
| 2022 | $10,219 | $804,148 | $482,490 | $321,658 |
| 2021 | $10,036 | $788,382 | $473,030 | $315,352 |
| 2020 | $10,142 | $780,300 | $468,180 | $312,120 |
| 2019 | $9,748 | $765,000 | $459,000 | $306,000 |
| 2018 | $1,189 | $42,186 | $14,866 | $27,320 |
| 2017 | $877 | $41,362 | $14,576 | $26,786 |
| 2016 | $830 | $40,554 | $14,292 | $26,262 |
| 2015 | $818 | $39,946 | $14,078 | $25,868 |
| 2014 | $798 | $39,166 | $13,804 | $25,362 |
Source: Public Records
Map
Nearby Homes
- 3657 California St
- 56-58 Parker Ave
- 130 2nd Ave
- 3234 Clement St
- 116 Cherry St
- 622 Spruce St
- 3 Presidio Terrace
- 38 Presidio Terrace
- 660 Spruce St
- 3515 Sacramento St
- 315 Laurel St
- 334-336 4th Ave
- 440 Laurel St
- 21 Wood St
- 23 Wood St
- 236 6th Ave Unit 238
- 112 Stanyan St
- 474 2nd Ave
- 432 4th Ave
- 120 7th Ave
- 8 Jordan Ave Unit 7
- 8 Jordan Ave Unit 3
- 8 Jordan Ave Unit 2
- 8 Jordan Ave Unit 10
- 8 Jordan Ave Unit 4
- 8 Jordan Ave Unit 12
- 8 Jordan Ave Unit 6
- 8 Jordan Ave Unit 5
- 8 Jordan Ave Unit 11
- 8 Jordan Ave Unit 9
- 12 Jordan Ave
- 3775 California St Unit 3
- 18 Jordan Ave
- 22 Jordan Ave
- 3 Commonwealth Ave
- 11 Commonwealth Ave
- 17 Commonwealth Ave
- 26 Jordan Ave
- 21 Commonwealth Ave
- 27 Commonwealth Ave