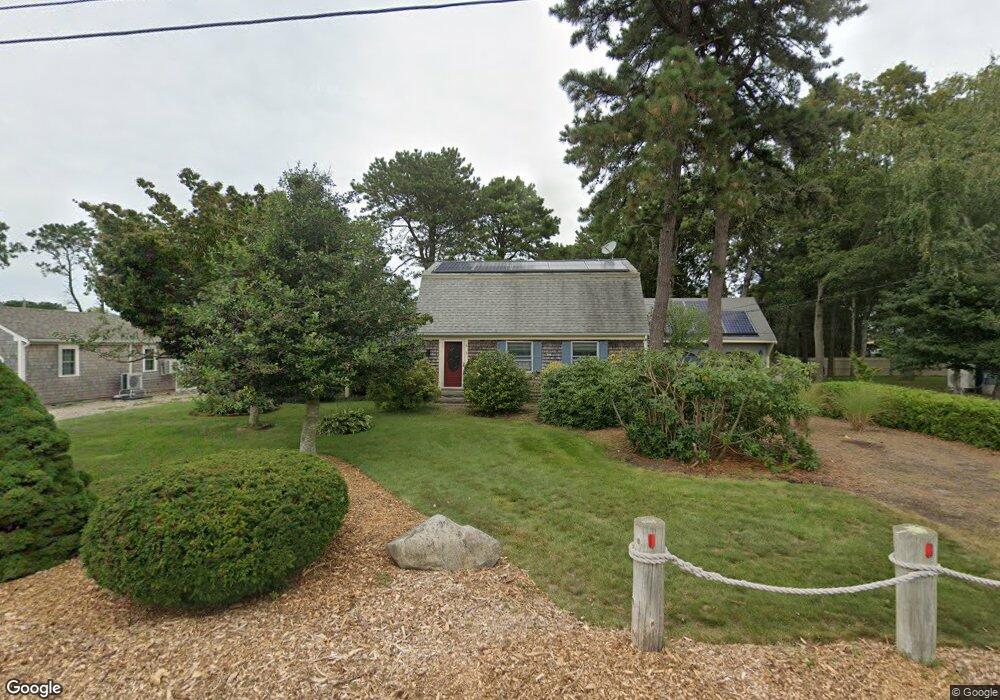
8 Joyce St South Yarmouth, MA 02664
Estimated Value: $619,954 - $692,000
1
Bed
3
Baths
2,028
Sq Ft
$318/Sq Ft
Est. Value
About This Home
This home is located at 8 Joyce St, South Yarmouth, MA 02664 and is currently estimated at $645,489, approximately $318 per square foot. 8 Joyce St is a home located in Barnstable County with nearby schools including Dennis-Yarmouth Regional High School and St. Pius X. School.
Ownership History
Date
Name
Owned For
Owner Type
Purchase Details
Closed on
Sep 10, 2008
Sold by
Swanson Elizabeth H and Swanson Russell W
Bought by
Bette Hall Swanson Lt and Swanson Elizabeth H
Current Estimated Value
Purchase Details
Closed on
Nov 30, 1988
Sold by
Choate Milton G
Bought by
Swanson Russell W
Create a Home Valuation Report for This Property
The Home Valuation Report is an in-depth analysis detailing your home's value as well as a comparison with similar homes in the area
Home Values in the Area
Average Home Value in this Area
Purchase History
| Date | Buyer | Sale Price | Title Company |
|---|---|---|---|
| Bette Hall Swanson Lt | -- | -- | |
| Swanson Russell W | $139,900 | -- |
Source: Public Records
Mortgage History
| Date | Status | Borrower | Loan Amount |
|---|---|---|---|
| Previous Owner | Swanson Russell W | $100,000 | |
| Previous Owner | Swanson Russell W | $55,000 | |
| Previous Owner | Swanson Russell W | $117,500 | |
| Previous Owner | Swanson Russell W | $117,500 |
Source: Public Records
Tax History Compared to Growth
Tax History
| Year | Tax Paid | Tax Assessment Tax Assessment Total Assessment is a certain percentage of the fair market value that is determined by local assessors to be the total taxable value of land and additions on the property. | Land | Improvement |
|---|---|---|---|---|
| 2025 | $3,597 | $508,000 | $178,900 | $329,100 |
| 2024 | $3,290 | $445,800 | $151,300 | $294,500 |
| 2023 | $3,323 | $409,700 | $131,000 | $278,700 |
| 2022 | $3,375 | $367,600 | $119,000 | $248,600 |
| 2021 | $3,063 | $320,400 | $119,000 | $201,400 |
| 2020 | $3,065 | $306,500 | $119,000 | $187,500 |
| 2019 | $2,936 | $290,700 | $119,000 | $171,700 |
| 2018 | $2,810 | $273,100 | $101,400 | $171,700 |
| 2017 | $2,692 | $268,700 | $97,000 | $171,700 |
| 2016 | $2,594 | $259,900 | $88,200 | $171,700 |
| 2015 | $2,655 | $264,400 | $88,200 | $176,200 |
Source: Public Records
Map
Nearby Homes