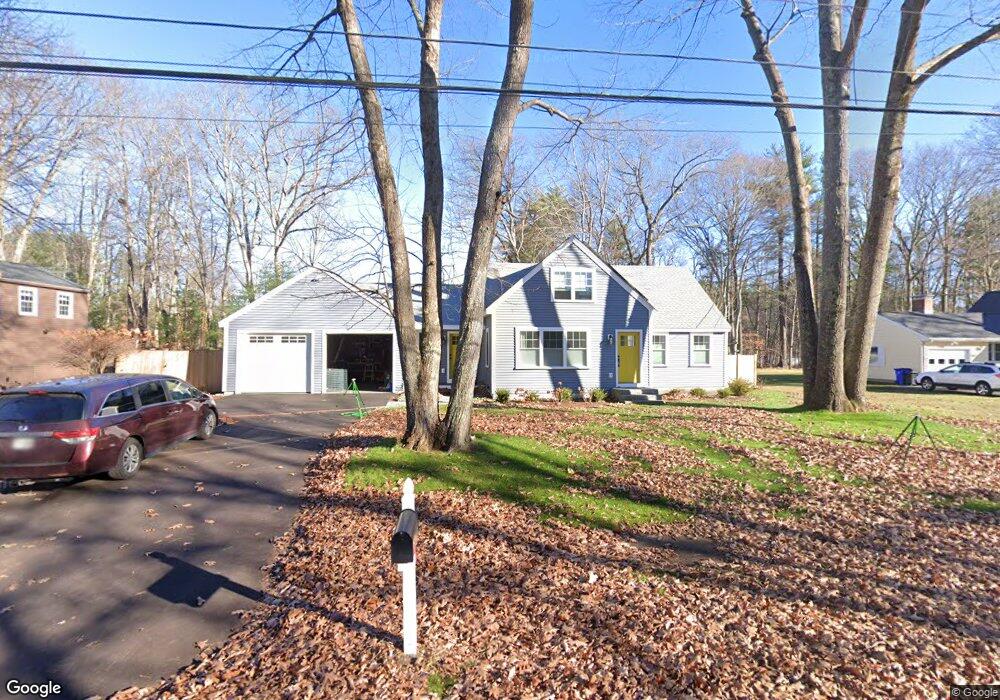
8 Kathleen Dr Exeter, NH 03833
Estimated Value: $744,000 - $823,000
4
Beds
2
Baths
2,300
Sq Ft
$335/Sq Ft
Est. Value
About This Home
This home is located at 8 Kathleen Dr, Exeter, NH 03833 and is currently estimated at $771,261, approximately $335 per square foot. 8 Kathleen Dr is a home located in Rockingham County with nearby schools including Main Street School, Lincoln Street Elementary School, and Cooperative Middle School.
Ownership History
Date
Name
Owned For
Owner Type
Purchase Details
Closed on
Feb 26, 2016
Sold by
Fallon Adam F and Fallon Angela C
Bought by
Fallon Ft and Fallon Adam F
Current Estimated Value
Purchase Details
Closed on
Oct 15, 2009
Sold by
Smith William H and Smith Jacqueline A
Bought by
Fallon Adam F and Fallon Angela C
Home Financials for this Owner
Home Financials are based on the most recent Mortgage that was taken out on this home.
Original Mortgage
$294,467
Interest Rate
5.14%
Mortgage Type
Purchase Money Mortgage
Create a Home Valuation Report for This Property
The Home Valuation Report is an in-depth analysis detailing your home's value as well as a comparison with similar homes in the area
Home Values in the Area
Average Home Value in this Area
Purchase History
| Date | Buyer | Sale Price | Title Company |
|---|---|---|---|
| Fallon Ft | -- | -- | |
| Fallon Adam F | $299,900 | -- |
Source: Public Records
Mortgage History
| Date | Status | Borrower | Loan Amount |
|---|---|---|---|
| Previous Owner | Fallon Adam F | $248,000 | |
| Previous Owner | Fallon Adam F | $294,467 | |
| Previous Owner | Fallon Adam F | $80,000 |
Source: Public Records
Tax History
| Year | Tax Paid | Tax Assessment Tax Assessment Total Assessment is a certain percentage of the fair market value that is determined by local assessors to be the total taxable value of land and additions on the property. | Land | Improvement |
|---|---|---|---|---|
| 2025 | $12,383 | $660,100 | $278,600 | $381,500 |
| 2024 | $11,743 | $660,100 | $278,600 | $381,500 |
| 2023 | $10,067 | $375,900 | $163,900 | $212,000 |
| 2022 | $9,304 | $375,900 | $163,900 | $212,000 |
| 2021 | $9,025 | $375,900 | $163,900 | $212,000 |
| 2020 | $9,206 | $375,900 | $163,900 | $212,000 |
| 2019 | $8,747 | $375,900 | $163,900 | $212,000 |
| 2018 | $5,438 | $306,700 | $120,500 | $186,200 |
| 2017 | $5,230 | $306,700 | $120,500 | $186,200 |
| 2016 | $8,048 | $306,700 | $120,500 | $186,200 |
| 2015 | $7,833 | $306,700 | $120,500 | $186,200 |
| 2014 | $8,037 | $308,400 | $109,500 | $198,900 |
| 2013 | $7,989 | $306,900 | $109,500 | $197,400 |
| 2011 | $7,758 | $306,900 | $109,500 | $197,400 |
Source: Public Records
Map
Nearby Homes
- 131 Court St Unit 21
- 31 Cypress Cir
- 4 Dow St
- 139 Robinhood Dr
- 95 Court St Unit 1
- 14 Sir Lancelot Dr
- 6 Dow St
- 12 Cornwall St
- 50 Linden St
- 202 Robinhood Dr Unit 202RH
- 210 Robin Hood Ln Unit 210RH
- 220 Robinhood Dr Unit 220
- 113 Linden St
- 609 Canterbury Dr
- 204 N Haverhill Rd
- 13 Bell Ave
- 23 Sumac St
- 614 Canterbury Dr
- 115 Front St
- 311 Friar Tuck Dr
Your Personal Tour Guide
Ask me questions while you tour the home.