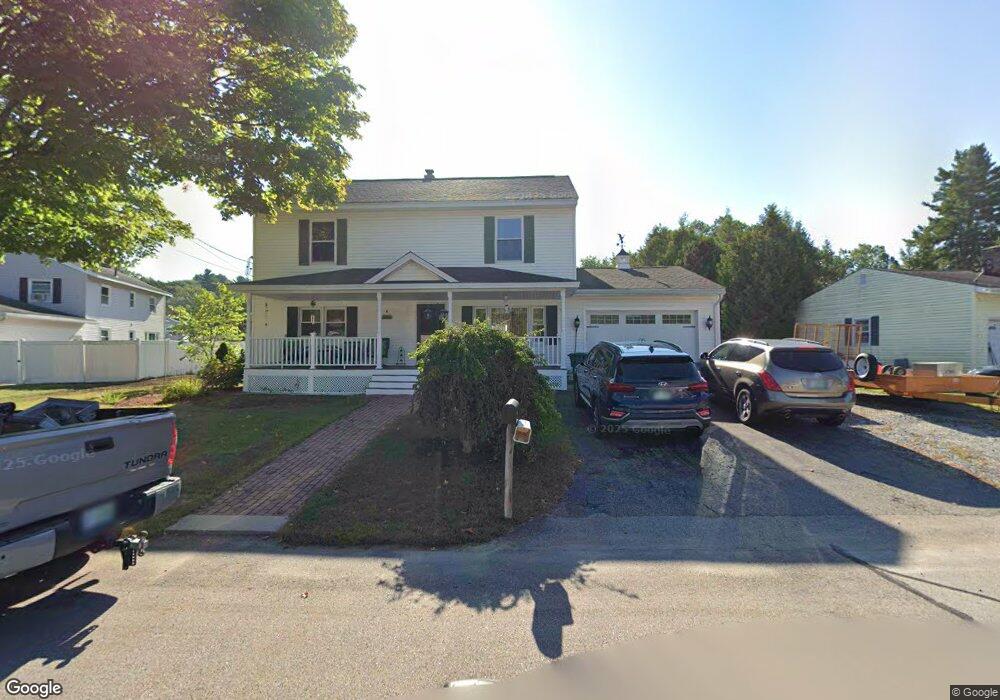
8 Kerry Ln Nashua, NH 03062
Southwest Nashua NeighborhoodEstimated Value: $569,000 - $594,000
4
Beds
3
Baths
2,016
Sq Ft
$289/Sq Ft
Est. Value
About This Home
This home is located at 8 Kerry Ln, Nashua, NH 03062 and is currently estimated at $582,355, approximately $288 per square foot. 8 Kerry Ln is a home located in Hillsborough County with nearby schools including Bicentennial Elementary School, Fairgrounds Middle School, and Nashua High School South.
Ownership History
Date
Name
Owned For
Owner Type
Purchase Details
Closed on
Jul 31, 2012
Sold by
Worster Patricia S and Martin Lionel S
Bought by
Worster Patricia S and Martin Lionel S
Current Estimated Value
Purchase Details
Closed on
Nov 19, 2007
Sold by
8 Kerry Lane Rt and Ellis
Bought by
Martin Lionel S
Home Financials for this Owner
Home Financials are based on the most recent Mortgage that was taken out on this home.
Original Mortgage
$240,000
Interest Rate
6.41%
Mortgage Type
Purchase Money Mortgage
Create a Home Valuation Report for This Property
The Home Valuation Report is an in-depth analysis detailing your home's value as well as a comparison with similar homes in the area
Home Values in the Area
Average Home Value in this Area
Purchase History
| Date | Buyer | Sale Price | Title Company |
|---|---|---|---|
| Worster Patricia S | -- | -- | |
| Worster Patricia S | -- | -- | |
| Martin Lionel S | $240,000 | -- |
Source: Public Records
Mortgage History
| Date | Status | Borrower | Loan Amount |
|---|---|---|---|
| Previous Owner | Martin Lionel S | $240,000 |
Source: Public Records
Tax History Compared to Growth
Tax History
| Year | Tax Paid | Tax Assessment Tax Assessment Total Assessment is a certain percentage of the fair market value that is determined by local assessors to be the total taxable value of land and additions on the property. | Land | Improvement |
|---|---|---|---|---|
| 2024 | $8,020 | $504,400 | $162,800 | $341,600 |
| 2023 | $7,456 | $409,000 | $130,300 | $278,700 |
| 2022 | $7,391 | $409,000 | $130,300 | $278,700 |
| 2021 | $6,864 | $295,600 | $86,800 | $208,800 |
| 2020 | $6,684 | $295,600 | $86,800 | $208,800 |
| 2019 | $6,432 | $295,600 | $86,800 | $208,800 |
| 2018 | $6,270 | $295,600 | $86,800 | $208,800 |
| 2017 | $6,876 | $266,600 | $74,300 | $192,300 |
| 2016 | $6,684 | $266,600 | $74,300 | $192,300 |
| 2015 | $6,540 | $266,600 | $74,300 | $192,300 |
| 2014 | $6,412 | $266,600 | $74,300 | $192,300 |
Source: Public Records
Map
Nearby Homes
- 29 Dickens St
- 57 Wethersfield Rd
- 33 Cannon Dr
- 116 Lille Rd
- 125 Lille Rd
- 29 Greenwood Dr
- 23 Glen Dr
- 188 Harris Rd
- 285 E Dunstable Rd
- 17 Herrick St
- 15 Westray Dr
- 31 Tenby Dr
- 5 Wilderness Dr
- 10 Lamb Rd
- 15 Learned St Unit 123
- 6 Hayden St
- 4 Henry David Dr Unit 203
- 36 Eastman St Unit 26
- 62 Stillwater Dr Unit U135
- 51 Legacy Dr