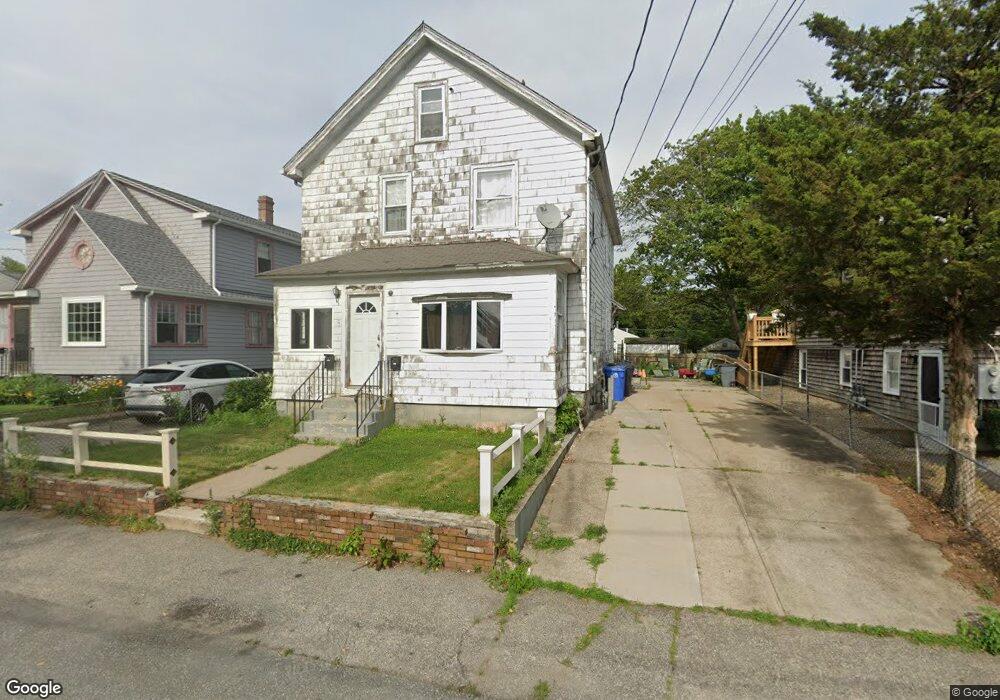
8 Kinsman St Cumberland, RI 02864
Valley Falls NeighborhoodEstimated Value: $448,216 - $558,000
6
Beds
2
Baths
2,516
Sq Ft
$207/Sq Ft
Est. Value
About This Home
This home is located at 8 Kinsman St, Cumberland, RI 02864 and is currently estimated at $520,054, approximately $206 per square foot. 8 Kinsman St is a home located in Providence County with nearby schools including B.F. Norton Elementary School, Joseph L. McCourt Middle School, and Cumberland High School.
Ownership History
Date
Name
Owned For
Owner Type
Purchase Details
Closed on
Jun 18, 2021
Sold by
Therrien Steven J
Bought by
Therrien Marcy J
Current Estimated Value
Purchase Details
Closed on
Dec 8, 2005
Sold by
Schwin Allan W
Bought by
Therrien Steven and Therrien Marcy
Home Financials for this Owner
Home Financials are based on the most recent Mortgage that was taken out on this home.
Original Mortgage
$160,000
Interest Rate
6.17%
Mortgage Type
Purchase Money Mortgage
Purchase Details
Closed on
Jun 5, 2001
Sold by
Manso Alvaro A and Manso Adelaide A
Bought by
Schwinn Allan W
Create a Home Valuation Report for This Property
The Home Valuation Report is an in-depth analysis detailing your home's value as well as a comparison with similar homes in the area
Home Values in the Area
Average Home Value in this Area
Purchase History
| Date | Buyer | Sale Price | Title Company |
|---|---|---|---|
| Therrien Marcy J | -- | None Available | |
| Therrien Steven | $200,000 | -- | |
| Schwinn Allan W | $159,900 | -- |
Source: Public Records
Mortgage History
| Date | Status | Borrower | Loan Amount |
|---|---|---|---|
| Previous Owner | Schwinn Allan W | $252,000 | |
| Previous Owner | Schwinn Allan W | $211,000 | |
| Previous Owner | Schwinn Allan W | $160,000 |
Source: Public Records
Tax History Compared to Growth
Tax History
| Year | Tax Paid | Tax Assessment Tax Assessment Total Assessment is a certain percentage of the fair market value that is determined by local assessors to be the total taxable value of land and additions on the property. | Land | Improvement |
|---|---|---|---|---|
| 2025 | $4,396 | $358,300 | $124,700 | $233,600 |
| 2024 | $4,282 | $358,300 | $124,700 | $233,600 |
| 2023 | $4,163 | $358,300 | $124,700 | $233,600 |
| 2022 | $3,151 | $210,200 | $87,200 | $123,000 |
| 2021 | $3,098 | $210,200 | $87,200 | $123,000 |
| 2020 | $3,010 | $210,200 | $87,200 | $123,000 |
| 2019 | $2,958 | $186,300 | $72,800 | $113,500 |
| 2018 | $2,873 | $186,300 | $72,800 | $113,500 |
| 2017 | $2,834 | $186,300 | $72,800 | $113,500 |
| 2016 | $2,618 | $153,300 | $64,200 | $89,100 |
| 2015 | $2,618 | $153,300 | $64,200 | $89,100 |
| 2014 | $2,618 | $153,300 | $64,200 | $89,100 |
| 2013 | $2,981 | $188,900 | $64,800 | $124,100 |
Source: Public Records
Map
Nearby Homes
- 23 Hewes St
- 115 Waterman St
- 24 Pleasant St
- 46 Bowen St
- 17 E Earle St
- 113 Waterman St
- 36 England St
- 311 High St
- 16 Ingraham St
- 35 Forest Ave
- 28 Crowell St
- 16 Kent St
- 153 Morris St
- 3 Robin Hood Ln Unit 179
- 17 Mowry Ave
- 18 Meadowcrest Dr
- 513 Mendon Rd Unit 513
- 515 Mendon Rd Unit 515
- 1746 Lonsdale Ave Unit 10
- 300 England St