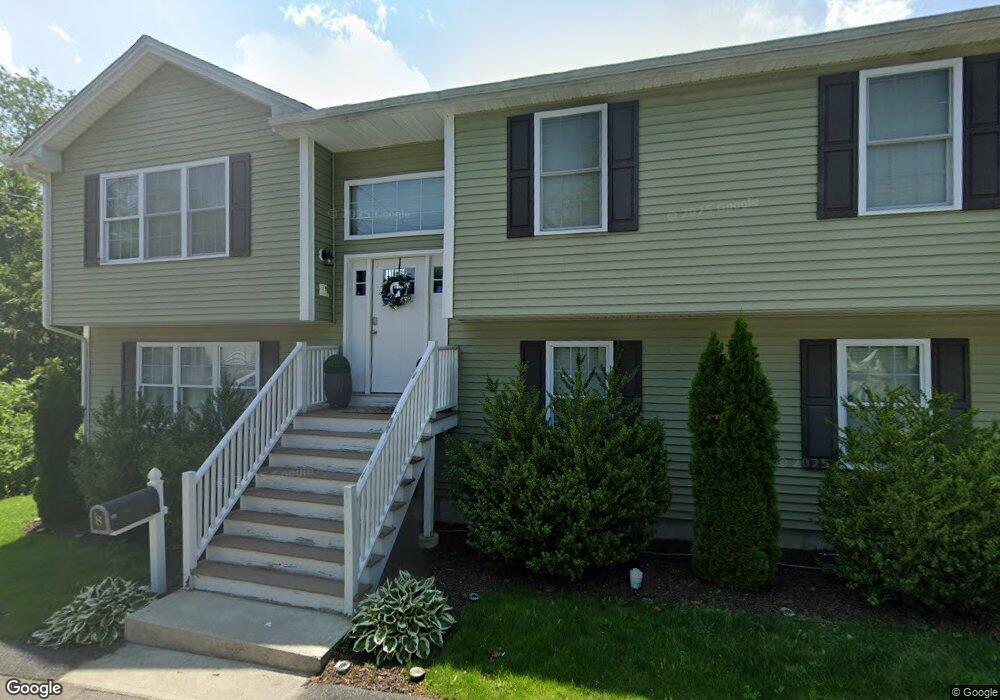
8 Lakeside St Providence, RI 02904
Charles NeighborhoodEstimated Value: $453,000 - $535,000
3
Beds
2
Baths
1,270
Sq Ft
$378/Sq Ft
Est. Value
About This Home
This home is located at 8 Lakeside St, Providence, RI 02904 and is currently estimated at $480,385, approximately $378 per square foot. 8 Lakeside St is a home with nearby schools including Times Squared Academy, Times2 Elementary School, and Times2 Middle/High School.
Ownership History
Date
Name
Owned For
Owner Type
Purchase Details
Closed on
Nov 30, 2016
Sold by
Imperial Investments I
Bought by
Dalomba Melissa P
Current Estimated Value
Home Financials for this Owner
Home Financials are based on the most recent Mortgage that was taken out on this home.
Original Mortgage
$230,743
Outstanding Balance
$187,350
Interest Rate
3.87%
Mortgage Type
FHA
Estimated Equity
$293,035
Purchase Details
Closed on
Jun 3, 2016
Sold by
Swank Development Llc
Bought by
Imperial Investment In
Purchase Details
Closed on
Feb 9, 2016
Sold by
Almon William D and Almon Carrie J
Bought by
Swank Development Llc
Create a Home Valuation Report for This Property
The Home Valuation Report is an in-depth analysis detailing your home's value as well as a comparison with similar homes in the area
Home Values in the Area
Average Home Value in this Area
Purchase History
| Date | Buyer | Sale Price | Title Company |
|---|---|---|---|
| Dalomba Melissa P | $235,000 | -- | |
| Imperial Investment In | $21,500 | -- | |
| Swank Development Llc | $16,900 | -- |
Source: Public Records
Mortgage History
| Date | Status | Borrower | Loan Amount |
|---|---|---|---|
| Open | Dalomba Melissa P | $230,743 |
Source: Public Records
Tax History
| Year | Tax Paid | Tax Assessment Tax Assessment Total Assessment is a certain percentage of the fair market value that is determined by local assessors to be the total taxable value of land and additions on the property. | Land | Improvement |
|---|---|---|---|---|
| 2025 | $3,661 | $435,800 | $142,500 | $293,300 |
| 2024 | $6,035 | $328,900 | $93,500 | $235,400 |
| 2023 | $6,035 | $328,900 | $93,500 | $235,400 |
| 2022 | $5,854 | $328,900 | $93,500 | $235,400 |
| 2021 | $6,464 | $263,200 | $78,900 | $184,300 |
| 2020 | $6,464 | $263,200 | $78,900 | $184,300 |
| 2019 | $6,464 | $263,200 | $78,900 | $184,300 |
| 2018 | $7,578 | $237,100 | $60,900 | $176,200 |
| 2017 | $7,578 | $237,100 | $60,900 | $176,200 |
| 2016 | $975 | $30,500 | $30,500 | $0 |
| 2015 | $1,019 | $30,800 | $30,800 | $0 |
| 2014 | $1,040 | $30,800 | $30,800 | $0 |
| 2013 | $1,040 | $30,800 | $30,800 | $0 |
Source: Public Records
Map
Nearby Homes
Your Personal Tour Guide
Ask me questions while you tour the home.