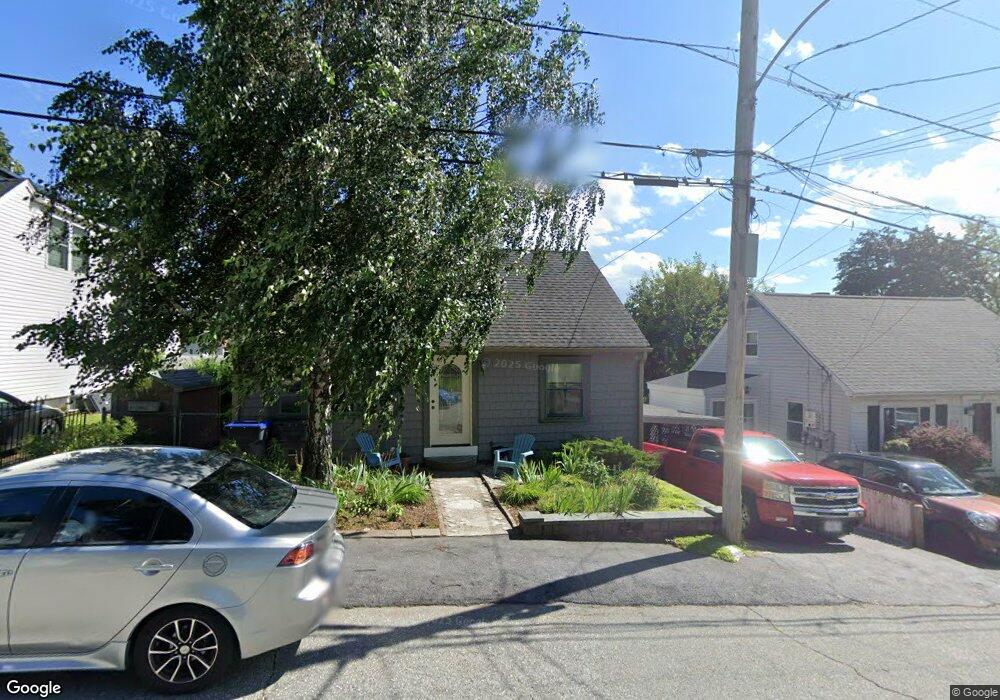
8 Laurel Ave Methuen, MA 01844
Downtown Methuen NeighborhoodEstimated Value: $485,000 - $537,000
3
Beds
1
Bath
1,440
Sq Ft
$352/Sq Ft
Est. Value
About This Home
This home is located at 8 Laurel Ave, Methuen, MA 01844 and is currently estimated at $506,817, approximately $351 per square foot. 8 Laurel Ave is a home located in Essex County with nearby schools including Tenney Grammar School, Methuen High School, and Lawrence Family Development Charter School.
Ownership History
Date
Name
Owned For
Owner Type
Purchase Details
Closed on
Sep 14, 2007
Sold by
Dellasanta Robert S Es and Dellasanta Dellasanta-Swann
Bought by
Anza Leonore
Current Estimated Value
Home Financials for this Owner
Home Financials are based on the most recent Mortgage that was taken out on this home.
Original Mortgage
$180,000
Outstanding Balance
$113,676
Interest Rate
6.7%
Mortgage Type
Purchase Money Mortgage
Estimated Equity
$393,141
Purchase Details
Closed on
Feb 21, 2003
Sold by
Haded James
Bought by
Dellasanta Robert
Home Financials for this Owner
Home Financials are based on the most recent Mortgage that was taken out on this home.
Original Mortgage
$184,500
Interest Rate
5.98%
Mortgage Type
Purchase Money Mortgage
Purchase Details
Closed on
May 22, 2002
Sold by
Haded Scott
Bought by
Haded James
Purchase Details
Closed on
Sep 6, 1989
Sold by
Smith Marion
Bought by
Tilbor Jerrold
Create a Home Valuation Report for This Property
The Home Valuation Report is an in-depth analysis detailing your home's value as well as a comparison with similar homes in the area
Home Values in the Area
Average Home Value in this Area
Purchase History
| Date | Buyer | Sale Price | Title Company |
|---|---|---|---|
| Anza Leonore | $255,000 | -- | |
| Anza Leonore | $255,000 | -- | |
| Dellasanta Robert | $205,000 | -- | |
| Dellasanta Robert | $205,000 | -- | |
| Haded James | $175,000 | -- | |
| Haded James | $175,000 | -- | |
| Tilbor Jerrold | $115,000 | -- |
Source: Public Records
Mortgage History
| Date | Status | Borrower | Loan Amount |
|---|---|---|---|
| Open | Anza Leonore | $180,000 | |
| Closed | Tilbor Jerrold | $180,000 | |
| Previous Owner | Tilbor Jerrold | $184,500 |
Source: Public Records
Tax History
| Year | Tax Paid | Tax Assessment Tax Assessment Total Assessment is a certain percentage of the fair market value that is determined by local assessors to be the total taxable value of land and additions on the property. | Land | Improvement |
|---|---|---|---|---|
| 2025 | $4,580 | $432,900 | $192,400 | $240,500 |
| 2024 | $4,518 | $416,000 | $175,500 | $240,500 |
| 2023 | $4,220 | $360,700 | $156,000 | $204,700 |
| 2022 | $3,899 | $298,800 | $123,500 | $175,300 |
| 2021 | $3,700 | $280,500 | $117,000 | $163,500 |
| 2020 | $3,707 | $275,800 | $117,000 | $158,800 |
| 2019 | $3,536 | $249,200 | $110,500 | $138,700 |
| 2018 | $3,356 | $235,200 | $104,000 | $131,200 |
| 2017 | $3,246 | $221,600 | $104,000 | $117,600 |
| 2016 | $2,922 | $197,300 | $91,000 | $106,300 |
| 2015 | $2,799 | $191,700 | $91,000 | $100,700 |
Source: Public Records
Map
Nearby Homes
- 76 Haverhill St
- 13 Caswell Ave
- 945 Riverside Dr Unit 3B
- 42-44 Cypress Ave
- 14-16 Cypress Ave
- 1 Perry Ave
- 1146 Essex St
- 1100 Essex St
- 1082 Essex St
- 1008 Essex St Unit 1010
- 22 Falcon St
- 19 Oregon Ave
- 65 Clayton Ave
- 70 Butler St
- 11 Crescent St
- 15 Crescent St Unit D
- 499 Haverhill St
- 18 Doyle St
- 192 Lowell St
- 312 Water St Unit 4
Your Personal Tour Guide
Ask me questions while you tour the home.