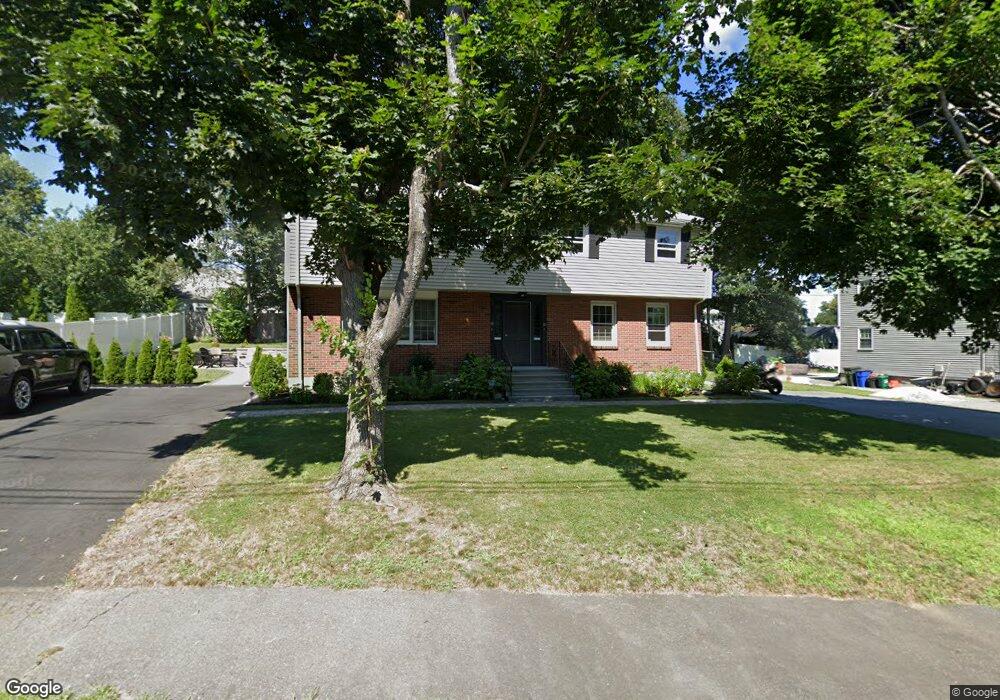
8 Lee St Unit 10 Stoneham, MA 02180
Lindenwood NeighborhoodEstimated Value: $843,000 - $1,127,000
4
Beds
4
Baths
2,484
Sq Ft
$386/Sq Ft
Est. Value
About This Home
This home is located at 8 Lee St Unit 10, Stoneham, MA 02180 and is currently estimated at $959,296, approximately $386 per square foot. 8 Lee St Unit 10 is a home located in Middlesex County with nearby schools including Stoneham High School, St. Patrick Elementary School, and Greater Boston Academy.
Ownership History
Date
Name
Owned For
Owner Type
Purchase Details
Closed on
May 25, 2020
Sold by
Albert D & Alma Russo Rt
Bought by
Barletta John
Current Estimated Value
Home Financials for this Owner
Home Financials are based on the most recent Mortgage that was taken out on this home.
Original Mortgage
$608,000
Outstanding Balance
$536,407
Interest Rate
3.3%
Mortgage Type
New Conventional
Estimated Equity
$422,889
Create a Home Valuation Report for This Property
The Home Valuation Report is an in-depth analysis detailing your home's value as well as a comparison with similar homes in the area
Home Values in the Area
Average Home Value in this Area
Purchase History
| Date | Buyer | Sale Price | Title Company |
|---|---|---|---|
| Barletta John | $760,000 | None Available |
Source: Public Records
Mortgage History
| Date | Status | Borrower | Loan Amount |
|---|---|---|---|
| Open | Barletta John | $608,000 |
Source: Public Records
Tax History
| Year | Tax Paid | Tax Assessment Tax Assessment Total Assessment is a certain percentage of the fair market value that is determined by local assessors to be the total taxable value of land and additions on the property. | Land | Improvement |
|---|---|---|---|---|
| 2025 | $8,407 | $821,800 | $400,000 | $421,800 |
| 2024 | $8,462 | $799,100 | $370,000 | $429,100 |
| 2023 | $8,537 | $769,100 | $340,000 | $429,100 |
| 2022 | $7,692 | $738,900 | $320,000 | $418,900 |
| 2021 | $7,563 | $699,000 | $300,000 | $399,000 |
| 2020 | $7,365 | $682,600 | $300,000 | $382,600 |
| 2019 | $6,855 | $611,000 | $270,000 | $341,000 |
| 2018 | $6,759 | $577,200 | $250,000 | $327,200 |
| 2017 | $6,236 | $503,300 | $240,000 | $263,300 |
| 2016 | $6,223 | $490,000 | $240,000 | $250,000 |
| 2015 | $6,265 | $483,400 | $240,000 | $243,400 |
| 2014 | $5,984 | $443,600 | $220,000 | $223,600 |
Source: Public Records
Map
Nearby Homes
- 1 Alden Ave
- 159 Main St Unit 27C
- 159 Main St Unit 39A
- 200 Ledgewood Dr Unit 601
- 98 Main St Unit 2
- 8 Steele St
- 1 Tremont St
- 66 Main St Unit 16A
- 66 Main St Unit 15A
- 12 Isola Ln
- 64 Main St Unit 24B
- 10 Pomeworth St Unit A
- 6 Stratton Dr Unit 307
- 6 Stratton Dr Unit 208
- 6 Stratton Dr Unit 303
- 18 Central St
- 21 Tremont St Unit B
- 21 Tremont St Unit A
- 16 Felton St
- 8 Common St Unit 3
Your Personal Tour Guide
Ask me questions while you tour the home.