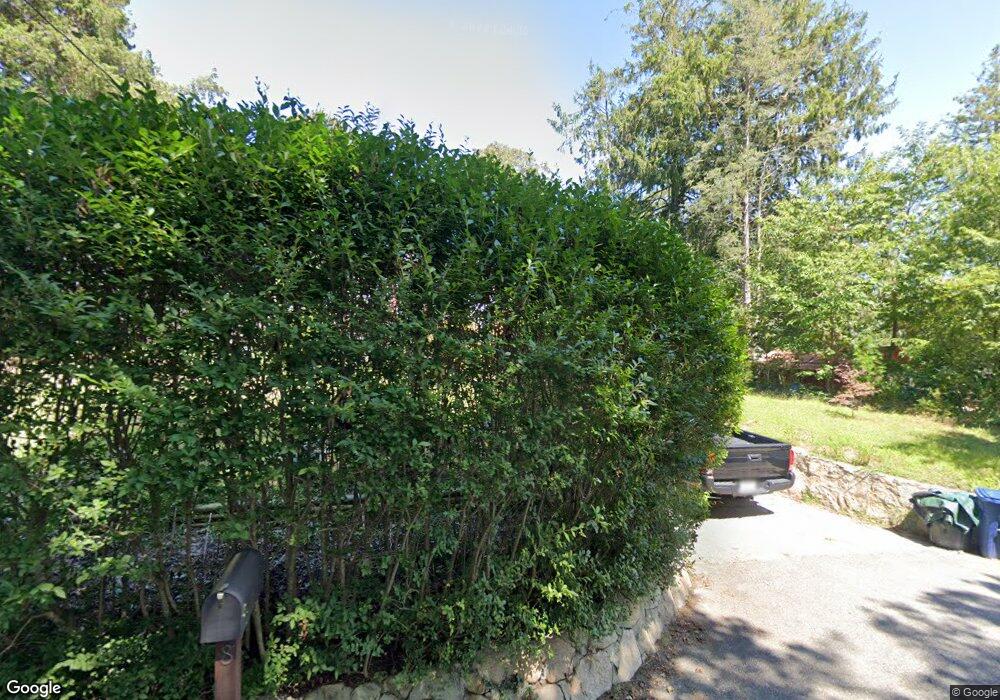
8 Leslie St Woods Hole, MA 02543
Estimated Value: $646,000 - $824,000
2
Beds
1
Bath
795
Sq Ft
$944/Sq Ft
Est. Value
About This Home
This home is located at 8 Leslie St, Woods Hole, MA 02543 and is currently estimated at $750,776, approximately $944 per square foot. 8 Leslie St is a home located in Barnstable County with nearby schools including Mullen-Hall School, Lawrence School, and Morse Pond School.
Ownership History
Date
Name
Owned For
Owner Type
Purchase Details
Closed on
Dec 10, 2020
Sold by
555 Llc
Bought by
Hames Matt and Mooney Christine
Current Estimated Value
Home Financials for this Owner
Home Financials are based on the most recent Mortgage that was taken out on this home.
Original Mortgage
$639,000
Outstanding Balance
$569,915
Interest Rate
2.8%
Mortgage Type
Purchase Money Mortgage
Estimated Equity
$180,861
Purchase Details
Closed on
Mar 7, 2019
Sold by
Paterson Benjamin L
Bought by
Paterson Benjamin L and Mora-Paterson Jordan W
Purchase Details
Closed on
Jun 24, 2016
Sold by
Vine Norman H
Bought by
Paterson Benjamin L
Purchase Details
Closed on
Oct 15, 1986
Bought by
Vine Norman H
Create a Home Valuation Report for This Property
The Home Valuation Report is an in-depth analysis detailing your home's value as well as a comparison with similar homes in the area
Home Values in the Area
Average Home Value in this Area
Purchase History
| Date | Buyer | Sale Price | Title Company |
|---|---|---|---|
| Hames Matt | $710,000 | None Available | |
| Paterson Benjamin L | -- | -- | |
| Paterson Benjamin L | -- | -- | |
| Paterson Benjamin L | $275,000 | -- | |
| Vine Norman H | -- | -- | |
| Paterson Benjamin L | $275,000 | -- |
Source: Public Records
Mortgage History
| Date | Status | Borrower | Loan Amount |
|---|---|---|---|
| Open | Hames Matt | $639,000 | |
| Previous Owner | Vine Norman H | $150,000 | |
| Closed | Paterson Benjamin L | $0 |
Source: Public Records
Tax History Compared to Growth
Tax History
| Year | Tax Paid | Tax Assessment Tax Assessment Total Assessment is a certain percentage of the fair market value that is determined by local assessors to be the total taxable value of land and additions on the property. | Land | Improvement |
|---|---|---|---|---|
| 2025 | $3,551 | $605,000 | $323,400 | $281,600 |
| 2024 | $3,467 | $552,100 | $294,000 | $258,100 |
| 2023 | $3,579 | $517,200 | $294,000 | $223,200 |
| 2022 | $3,652 | $453,700 | $268,100 | $185,600 |
| 2021 | $3,607 | $424,400 | $256,500 | $167,900 |
| 2020 | $3,427 | $399,000 | $233,200 | $165,800 |
| 2019 | $3,318 | $387,600 | $233,200 | $154,400 |
| 2018 | $3,206 | $372,800 | $233,200 | $139,600 |
| 2017 | $2,566 | $300,800 | $233,200 | $67,600 |
| 2016 | $2,576 | $307,800 | $233,200 | $74,600 |
| 2015 | $2,521 | $307,800 | $233,200 | $74,600 |
| 2014 | $2,529 | $310,300 | $233,200 | $77,100 |
Source: Public Records
Map
Nearby Homes
- 9 Strawberry Hill Rd
- 9 Strawberry Hill Rd
- 533 Woods Hole Rd Unit B101
- 533 Woods Hole Rd Unit D101
- 533 Woods Hole Rd Unit B102
- 533 Woods Hole Rd Unit E202
- 533 Woods Hole Rd Unit E301
- 82 Harbor Hill Rd
- 29 Wilson Rd
- 14 School St
- 10 Quissett Ave
- 76 F r Lillie Rd
- 54 Whitman Rd
- 5 Park Rd
- 87 Oyster Pond Rd
- 251 Woods Hole Rd
- 71 Oyster Pond Rd
- 44 Carey Ln
- 38 Landfall Unit 38
- 38 Landfall