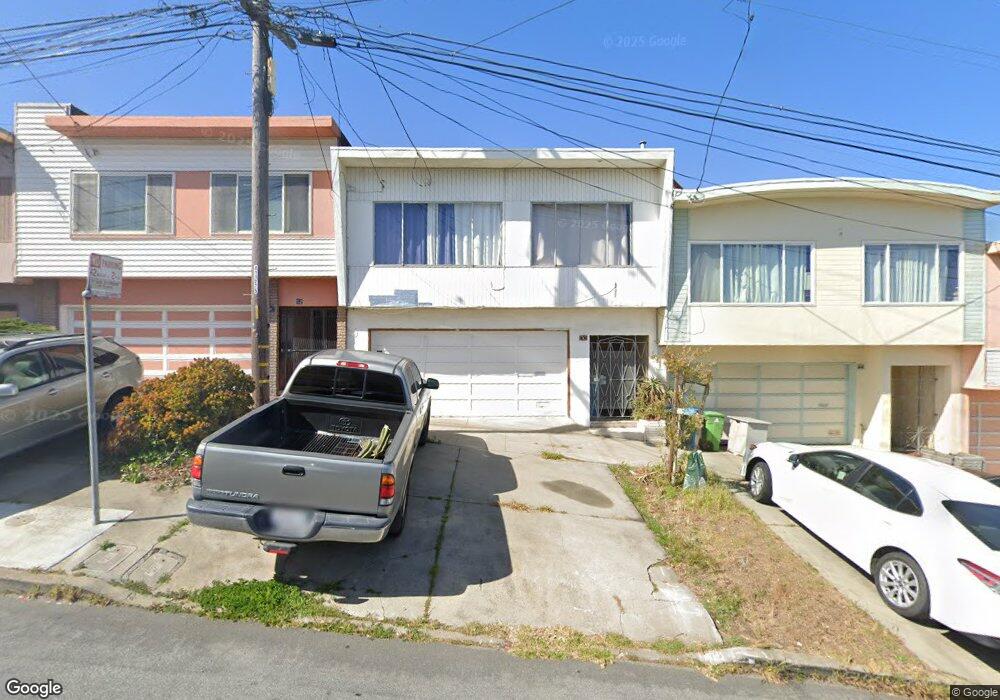
8 Lobos St San Francisco, CA 94112
Oceanview NeighborhoodEstimated Value: $790,000 - $1,431,000
--
Bed
2
Baths
1,634
Sq Ft
$748/Sq Ft
Est. Value
About This Home
This home is located at 8 Lobos St, San Francisco, CA 94112 and is currently estimated at $1,222,299, approximately $748 per square foot. 8 Lobos St is a home located in San Francisco County with nearby schools including Sheridan Elementary School, Denman (James) Middle School, and Leadership High School.
Ownership History
Date
Name
Owned For
Owner Type
Purchase Details
Closed on
Apr 5, 2007
Sold by
Larson Margherita S and Larson Charles I
Bought by
Altamirano Fructuoso Ordaz
Current Estimated Value
Home Financials for this Owner
Home Financials are based on the most recent Mortgage that was taken out on this home.
Original Mortgage
$564,800
Outstanding Balance
$343,367
Interest Rate
6.25%
Mortgage Type
Purchase Money Mortgage
Estimated Equity
$878,932
Purchase Details
Closed on
Feb 10, 1998
Sold by
World Savings & Loan Assoc
Bought by
Larson Charles I and Larson Margherita S
Home Financials for this Owner
Home Financials are based on the most recent Mortgage that was taken out on this home.
Original Mortgage
$145,125
Interest Rate
6.97%
Purchase Details
Closed on
May 9, 1995
Sold by
Vanni Joseph L and Vanni Virginia A
Bought by
World S&L Assn
Create a Home Valuation Report for This Property
The Home Valuation Report is an in-depth analysis detailing your home's value as well as a comparison with similar homes in the area
Home Values in the Area
Average Home Value in this Area
Purchase History
| Date | Buyer | Sale Price | Title Company |
|---|---|---|---|
| Altamirano Fructuoso Ordaz | $706,000 | Financial Title Company | |
| Larson Charles I | $193,500 | Fidelity National Title Co | |
| World S&L Assn | $209,000 | Fidelity National Title Co |
Source: Public Records
Mortgage History
| Date | Status | Borrower | Loan Amount |
|---|---|---|---|
| Open | Altamirano Fructuoso Ordaz | $564,800 | |
| Previous Owner | Larson Charles I | $145,125 |
Source: Public Records
Tax History Compared to Growth
Tax History
| Year | Tax Paid | Tax Assessment Tax Assessment Total Assessment is a certain percentage of the fair market value that is determined by local assessors to be the total taxable value of land and additions on the property. | Land | Improvement |
|---|---|---|---|---|
| 2025 | $11,652 | $945,876 | $567,528 | $378,348 |
| 2024 | $11,652 | $927,330 | $556,400 | $370,930 |
| 2023 | $11,473 | $909,148 | $545,491 | $363,657 |
| 2022 | $11,248 | $891,323 | $534,796 | $356,527 |
| 2021 | $11,047 | $873,847 | $524,310 | $349,537 |
| 2020 | $11,155 | $864,887 | $518,934 | $345,953 |
| 2019 | $10,777 | $847,929 | $508,759 | $339,170 |
| 2018 | $10,412 | $831,304 | $498,784 | $332,520 |
| 2017 | $9,991 | $815,004 | $489,004 | $326,000 |
| 2016 | $9,814 | $799,024 | $479,416 | $319,608 |
| 2015 | $9,536 | $774,000 | $503,100 | $270,900 |
| 2014 | $8,594 | $700,000 | $420,000 | $280,000 |
Source: Public Records
Map
Nearby Homes
- 171 Margaret Ave
- 63 Minerva St
- 5000 Summit St
- 502 Plymouth Ave
- 106 Broad St
- 2921 Alemany Blvd
- 34 Brighton Ave
- 615 Mount Vernon Ave
- 900 Huron Ave
- 108 Naglee Ave
- 914 Capitol Ave
- 5698 Mission St
- 274 Montana St
- 324 Holloway Ave
- 40 Acton St
- 35 Guttenberg St
- 20 Sargent St
- 841 Ocean Ave
- 86 Ellington Ave
- 713 Acton St