Estimated Value: $45,000 - $61,570
--
Bed
--
Bath
713
Sq Ft
$70/Sq Ft
Est. Value
About This Home
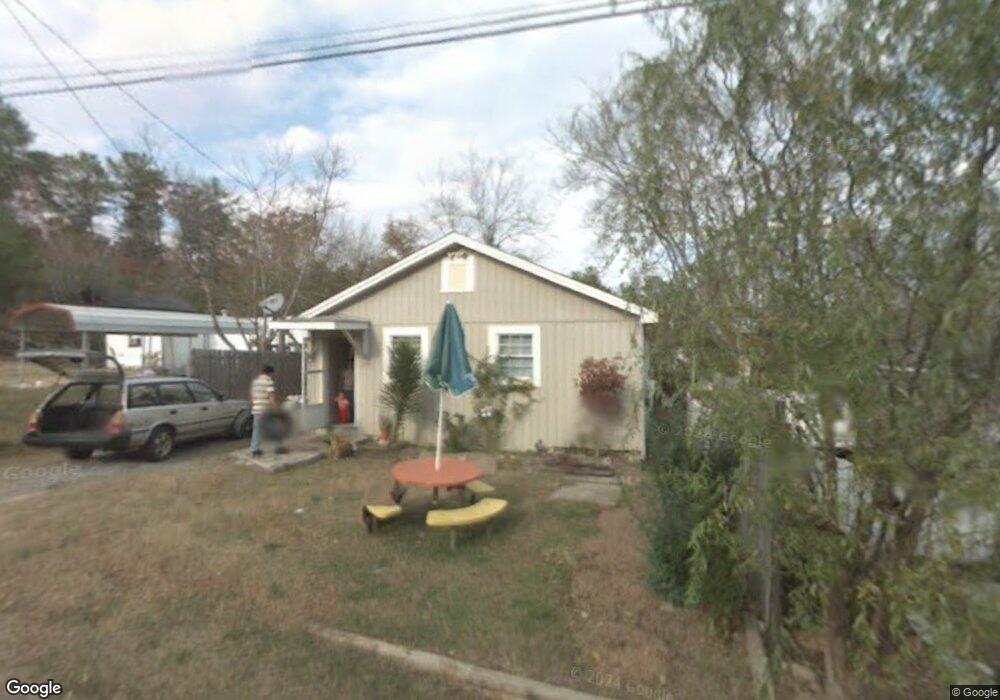
This home is located at 8 Loveless St SW, Rome, GA 30161 and is currently estimated at $50,143, approximately $70 per square foot. 8 Loveless St SW is a home located in Floyd County with nearby schools including Pepperell Middle School, Pepperell High School, and Darlington School.
Ownership History
Date
Name
Owned For
Owner Type
Purchase Details
Closed on
Sep 19, 2014
Sold by
Hardigree Barry C
Bought by
Hardigree Douglas
Current Estimated Value
Purchase Details
Closed on
Sep 14, 2014
Sold by
Hardigree Barry Curtis
Bought by
Long V Clarence
Purchase Details
Closed on
Mar 9, 1999
Bought by
P and R
Purchase Details
Closed on
Mar 2, 1998
Sold by
Cherokee Properties Inc
Bought by
Hardigree Barry
Purchase Details
Closed on
Jun 19, 1996
Sold by
Timms Billy
Bought by
Cherokee Properties Inc
Purchase Details
Closed on
May 15, 1996
Bought by
P and R
Purchase Details
Closed on
Mar 31, 1995
Bought by
P and R
Purchase Details
Closed on
Mar 29, 1995
Sold by
Summer Lloyd L
Bought by
Timms Billy
Purchase Details
Closed on
Jul 26, 1994
Bought by
P and R
Purchase Details
Closed on
Sep 27, 1985
Sold by
Merritt Richard L
Bought by
Summer Lloyd L
Purchase Details
Closed on
Jan 7, 1985
Sold by
Clemones W M
Bought by
Merritt Richard L
Purchase Details
Closed on
Jan 1, 1901
Bought by
Clemones W M
Create a Home Valuation Report for This Property
The Home Valuation Report is an in-depth analysis detailing your home's value as well as a comparison with similar homes in the area
Home Values in the Area
Average Home Value in this Area
Purchase History
| Date | Buyer | Sale Price | Title Company |
|---|---|---|---|
| Hardigree Douglas | -- | -- | |
| Long V Clarence | $15,000 | -- | |
| P | -- | -- | |
| Hardigree Barry | $3,000 | -- | |
| Cherokee Properties Inc | $5,300 | -- | |
| P | $8,600 | -- | |
| P | -- | -- | |
| Timms Billy | $29,000 | -- | |
| P | $1,000 | -- | |
| P | -- | -- | |
| Summer Lloyd L | $109,800 | -- | |
| Merritt Richard L | $107,500 | -- | |
| Clemones W M | -- | -- |
Source: Public Records
Tax History Compared to Growth
Tax History
| Year | Tax Paid | Tax Assessment Tax Assessment Total Assessment is a certain percentage of the fair market value that is determined by local assessors to be the total taxable value of land and additions on the property. | Land | Improvement |
|---|---|---|---|---|
| 2024 | $107 | $3,409 | $3,048 | $361 |
| 2023 | $98 | $3,054 | $2,710 | $344 |
| 2022 | $76 | $2,550 | $2,202 | $348 |
| 2021 | $72 | $2,397 | $2,202 | $195 |
| 2020 | $58 | $1,891 | $1,694 | $197 |
| 2019 | $57 | $1,894 | $1,694 | $200 |
| 2018 | $57 | $1,896 | $1,694 | $202 |
| 2017 | $57 | $1,898 | $1,694 | $204 |
| 2016 | $58 | $1,888 | $1,680 | $208 |
| 2015 | $56 | $1,888 | $1,680 | $208 |
| 2014 | $56 | $1,888 | $1,680 | $208 |
Source: Public Records
Map
Nearby Homes
- 0 Webb St
- 0 Webb St Unit LotWP001 21767756
- 36 Busby Ln
- 0 Cave Spring Rd SW Unit 10559551
- 0 Cave Spring Rd SW Unit 7611416
- 50 Wallace Dr SW
- 88 Watson Dr SW
- 44 Marvin Crowe Dr SW
- 2055 Blacks Bluff Rd SW
- 5323 Cedartown Hwy
- 0 Martha Berry Hwy Unit 7525627
- 0 Martha Berry Hwy Unit 7614774
- 0 Martha Berry Hwy Unit 10563404
- 2812 Maple Rd SE
- 2710 Maple Rd SE
- 270 N Edenfield Ridge Dr SE
- 5 Saint Andrews Way SW
- 25 Blacks Bluff Rd SW
- 0 Belle Meade Dr SW Unit 10504645
- 226 Flora Ave SE
- 6 Loveless St SW
- 4 Loveless St SW
- 7 Loveless St SW
- 3 Loveless St SW
- 1 Loveless St SW
- 1 Webb St SW
- 2 Loveless St SW
- 9 Loveless St SW
- 1500 Cave Spring Rd SW
- 3 Webb St SW
- 10 Loveless St SW
- 1354 Old Cave Springs Rd
- 1354 Old Cave Spring Rd SW
- 1350 Old Cave Spring Rd SW
- 39 Webb St SW
- 1346 Old Cave Spring Rd SW
- 1342 Old Cave Spring Rd SW
- 1340B Cave Spring Rd SW
- 1340 Cave Spring Rd SW
- 1340 Cave Spring Rd SW Unit B