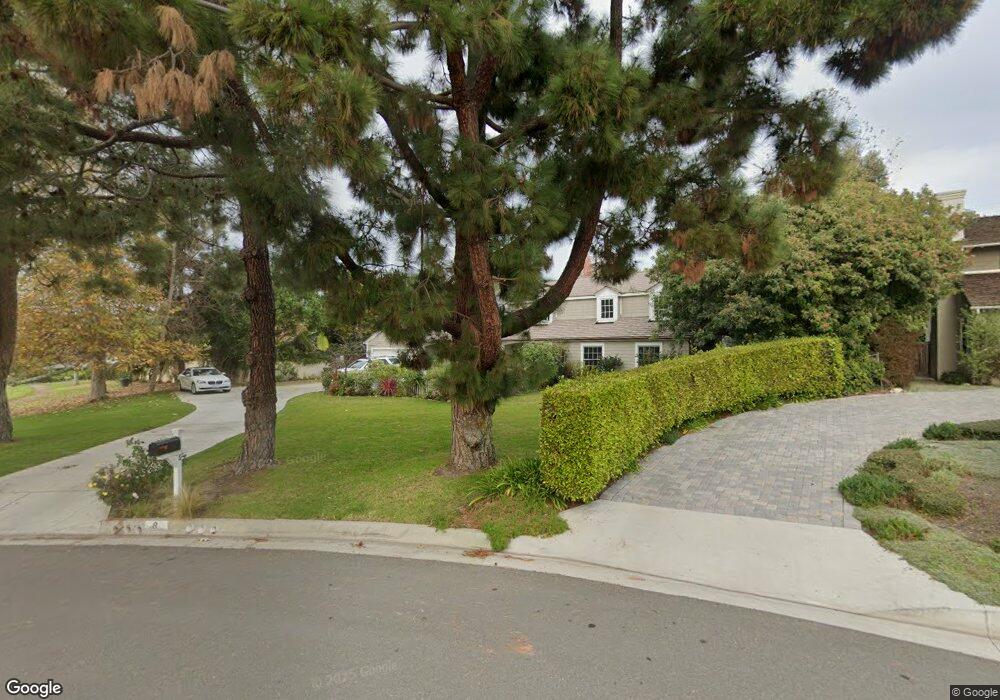
8 Lunada Bay Plaza Palos Verdes Estates, CA 90274
Estimated Value: $3,639,746 - $4,520,000
4
Beds
3
Baths
2,456
Sq Ft
$1,641/Sq Ft
Est. Value
About This Home
This home is located at 8 Lunada Bay Plaza, Palos Verdes Estates, CA 90274 and is currently estimated at $4,029,687, approximately $1,640 per square foot. 8 Lunada Bay Plaza is a home located in Los Angeles County with nearby schools including Lunada Bay Elementary School, Palos Verdes Intermediate School, and Palos Verdes High School.
Ownership History
Date
Name
Owned For
Owner Type
Purchase Details
Closed on
Feb 27, 2017
Sold by
Robinson Edward
Bought by
Robinson Edward M and Robinson Anne L
Current Estimated Value
Purchase Details
Closed on
Jun 6, 2003
Sold by
Hardy Mark Clayton
Bought by
Robinson Edward and Robinson Anne
Home Financials for this Owner
Home Financials are based on the most recent Mortgage that was taken out on this home.
Original Mortgage
$975,000
Interest Rate
5.15%
Mortgage Type
Purchase Money Mortgage
Purchase Details
Closed on
Sep 30, 1997
Sold by
Mcconlogue James R
Bought by
Hardy Mark Clayton and Hardy Shelley D
Home Financials for this Owner
Home Financials are based on the most recent Mortgage that was taken out on this home.
Original Mortgage
$612,800
Interest Rate
7.3%
Create a Home Valuation Report for This Property
The Home Valuation Report is an in-depth analysis detailing your home's value as well as a comparison with similar homes in the area
Home Values in the Area
Average Home Value in this Area
Purchase History
| Date | Buyer | Sale Price | Title Company |
|---|---|---|---|
| Robinson Edward M | -- | None Available | |
| Robinson Edward | $1,300,000 | Fidelity National Title | |
| Hardy Mark Clayton | $766,000 | First American Title Co |
Source: Public Records
Mortgage History
| Date | Status | Borrower | Loan Amount |
|---|---|---|---|
| Previous Owner | Robinson Edward | $975,000 | |
| Previous Owner | Hardy Mark Clayton | $612,800 | |
| Closed | Robinson Edward | $65,000 |
Source: Public Records
Tax History Compared to Growth
Tax History
| Year | Tax Paid | Tax Assessment Tax Assessment Total Assessment is a certain percentage of the fair market value that is determined by local assessors to be the total taxable value of land and additions on the property. | Land | Improvement |
|---|---|---|---|---|
| 2025 | $32,680 | $2,857,517 | $1,848,329 | $1,009,188 |
| 2024 | $32,680 | $2,801,488 | $1,812,088 | $989,400 |
| 2023 | $32,151 | $2,746,557 | $1,776,557 | $970,000 |
| 2022 | $30,561 | $2,692,704 | $1,741,723 | $950,981 |
| 2021 | $30,545 | $2,639,907 | $1,707,572 | $932,335 |
| 2019 | $29,246 | $2,561,608 | $1,656,925 | $904,683 |
| 2018 | $29,071 | $2,511,382 | $1,624,437 | $886,945 |
| 2016 | $27,601 | $2,413,863 | $1,561,359 | $852,504 |
| 2015 | $27,316 | $2,377,605 | $1,537,906 | $839,699 |
| 2014 | $26,906 | $2,331,032 | $1,507,781 | $823,251 |
Source: Public Records
Map
Nearby Homes
- 2552 Palos Verdes Dr W
- 2357 Palos Verdes Dr W Unit 3
- 2641 Palos Verdes Dr W
- 2300 Via Pacheco
- 2229 Thorley Place
- 2120 Palos Verdes Dr W
- 2116 Palos Verdes Dr W
- 2329 Via Olivera
- 2637 Via Olivera
- 2736 Paseo Del Mar
- 2729 Via Oleadas
- 2532 Vía Sanchez
- 128 Rocky Point Rd
- 1409 Via Davalos
- 2101 Paseo Del Mar
- 1413 Via Coronel
- 1232 Via Coronel
- 3300 Palos Verdes Dr W
- 28424 Golden Meadow Dr
- 1465 Via Coronel
- 2500 Via Pacheco
- 700 Avenida Mirola
- 2508 Via Pacheco
- 2517 Palos Verdes Dr W
- 2509 Palos Verdes Dr W
- 708 Avenida Mirola
- 2525 Palos Verdes Dr W
- 2516 Via Pacheco
- 2501 Via Pacheco
- 29 Lunada Bay Plaza
- 625 Via Estrada
- 616 Avenida Mirola
- 2549 Palos Verdes Dr W
- 43 Lunada Bay Plaza
- 36 Lunada Bay Plaza
- 2528 Via Pacheco
- 621 Via Estrada
- 709 Avenida Mirola
- 2553 Palos Verdes Dr W
- 701 Avenida Mirola