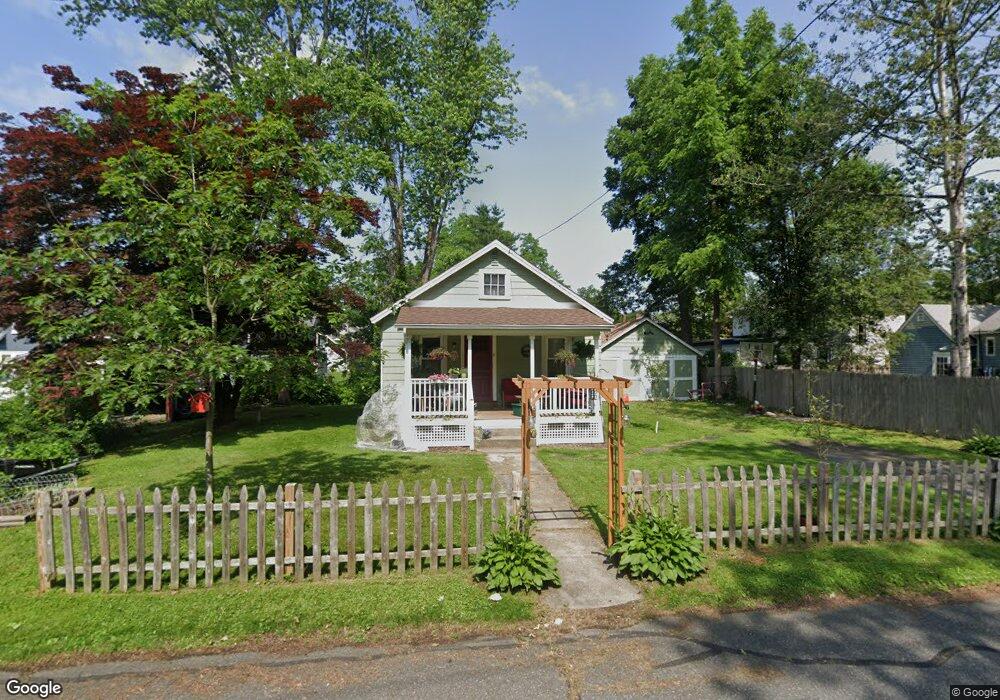
8 Maple Ln Greenfield, MA 01301
Estimated Value: $191,000 - $268,000
1
Bed
1
Bath
642
Sq Ft
$345/Sq Ft
Est. Value
About This Home
This home is located at 8 Maple Ln, Greenfield, MA 01301 and is currently estimated at $221,193, approximately $344 per square foot. 8 Maple Ln is a home located in Franklin County with nearby schools including Holy Trinity School and Cornerstone Christian School.
Ownership History
Date
Name
Owned For
Owner Type
Purchase Details
Closed on
Mar 21, 2022
Sold by
Allen James E Est and Deery
Bought by
Clarke Douglas P and Clarke Amy S
Current Estimated Value
Home Financials for this Owner
Home Financials are based on the most recent Mortgage that was taken out on this home.
Original Mortgage
$142,400
Outstanding Balance
$131,977
Interest Rate
3.55%
Mortgage Type
Purchase Money Mortgage
Estimated Equity
$89,216
Purchase Details
Closed on
Aug 26, 1997
Sold by
Richardson Gary A
Bought by
Allen James
Purchase Details
Closed on
Nov 4, 1992
Sold by
Lovell Dorothy E and Smith Gdn Mona
Bought by
Richardson Gary A
Create a Home Valuation Report for This Property
The Home Valuation Report is an in-depth analysis detailing your home's value as well as a comparison with similar homes in the area
Home Values in the Area
Average Home Value in this Area
Purchase History
| Date | Buyer | Sale Price | Title Company |
|---|---|---|---|
| Clarke Douglas P | $181,000 | None Available | |
| Clarke Douglas P | $181,000 | None Available | |
| Allen James | $55,000 | -- | |
| Allen James | $55,000 | -- | |
| Richardson Gary A | $50,000 | -- | |
| Richardson Gary A | $50,000 | -- |
Source: Public Records
Mortgage History
| Date | Status | Borrower | Loan Amount |
|---|---|---|---|
| Open | Clarke Douglas P | $142,400 | |
| Closed | Clarke Douglas P | $142,400 |
Source: Public Records
Tax History
| Year | Tax Paid | Tax Assessment Tax Assessment Total Assessment is a certain percentage of the fair market value that is determined by local assessors to be the total taxable value of land and additions on the property. | Land | Improvement |
|---|---|---|---|---|
| 2025 | $3,358 | $171,700 | $70,800 | $100,900 |
| 2024 | $3,234 | $158,600 | $58,300 | $100,300 |
| 2023 | $2,914 | $148,300 | $58,300 | $90,000 |
| 2022 | $3,004 | $134,600 | $55,600 | $79,000 |
| 2021 | $3,028 | $130,400 | $55,600 | $74,800 |
| 2020 | $2,839 | $123,800 | $55,600 | $68,200 |
| 2019 | $2,605 | $116,500 | $48,300 | $68,200 |
| 2018 | $2,557 | $114,000 | $47,200 | $66,800 |
| 2017 | $2,449 | $112,700 | $47,200 | $65,500 |
| 2016 | $2,458 | $112,700 | $50,000 | $62,700 |
| 2015 | $2,485 | $110,400 | $50,000 | $60,400 |
| 2014 | $2,267 | $110,400 | $50,000 | $60,400 |
Source: Public Records
Map
Nearby Homes
Your Personal Tour Guide
Ask me questions while you tour the home.