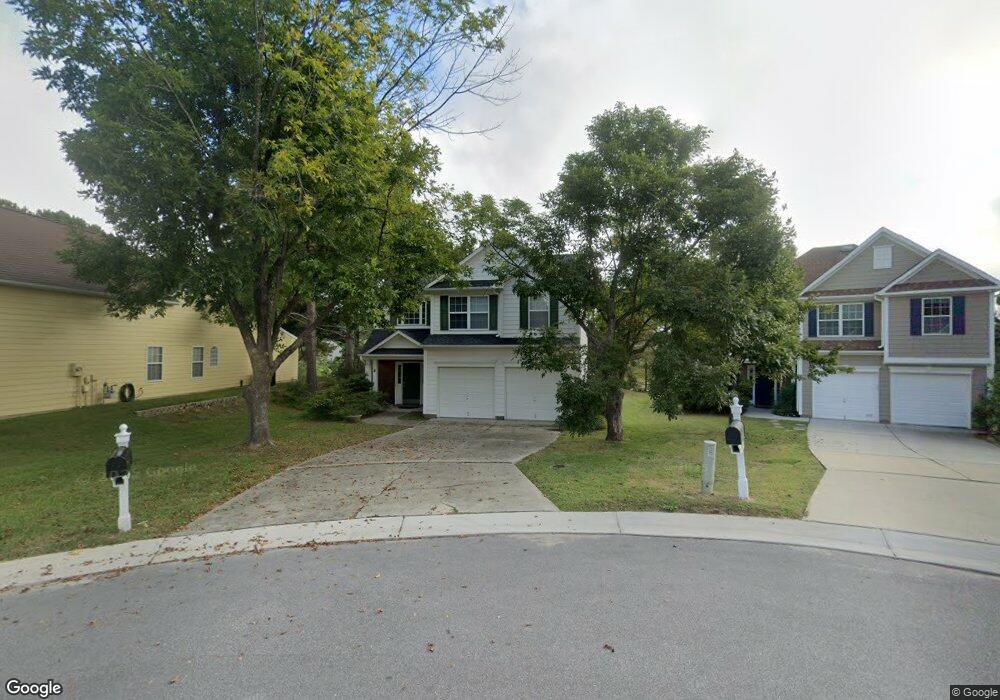
8 Marsh Landing Ct Durham, NC 27703
Eastern Durham NeighborhoodEstimated Value: $370,143 - $401,000
3
Beds
3
Baths
1,619
Sq Ft
$236/Sq Ft
Est. Value
About This Home
This home is located at 8 Marsh Landing Ct, Durham, NC 27703 and is currently estimated at $382,786, approximately $236 per square foot. 8 Marsh Landing Ct is a home located in Durham County with nearby schools including Oak Grove Elementary, John W Neal Middle School, and Southern School of Energy & Sustainability.
Ownership History
Date
Name
Owned For
Owner Type
Purchase Details
Closed on
Jun 18, 2008
Sold by
Nguyen Giang
Bought by
Griffin Michael Alan and Griffin Latoya Meschelle
Current Estimated Value
Home Financials for this Owner
Home Financials are based on the most recent Mortgage that was taken out on this home.
Original Mortgage
$185,000
Outstanding Balance
$110,592
Interest Rate
4.75%
Mortgage Type
Purchase Money Mortgage
Estimated Equity
$272,194
Purchase Details
Closed on
Apr 30, 2007
Sold by
Griffin Kathleen
Bought by
Nguyen Giang
Home Financials for this Owner
Home Financials are based on the most recent Mortgage that was taken out on this home.
Original Mortgage
$172,900
Interest Rate
6.1%
Mortgage Type
Purchase Money Mortgage
Purchase Details
Closed on
Sep 21, 1999
Sold by
D R Horton Inc Torrey
Bought by
Griffin Kathleen
Home Financials for this Owner
Home Financials are based on the most recent Mortgage that was taken out on this home.
Original Mortgage
$146,000
Interest Rate
6.87%
Create a Home Valuation Report for This Property
The Home Valuation Report is an in-depth analysis detailing your home's value as well as a comparison with similar homes in the area
Home Values in the Area
Average Home Value in this Area
Purchase History
| Date | Buyer | Sale Price | Title Company |
|---|---|---|---|
| Griffin Michael Alan | $185,000 | None Available | |
| Nguyen Giang | $173,000 | None Available | |
| Griffin Kathleen | $162,500 | -- |
Source: Public Records
Mortgage History
| Date | Status | Borrower | Loan Amount |
|---|---|---|---|
| Open | Griffin Michael Alan | $185,000 | |
| Previous Owner | Nguyen Giang | $172,900 | |
| Previous Owner | Griffin Kathleen | $146,000 |
Source: Public Records
Tax History
| Year | Tax Paid | Tax Assessment Tax Assessment Total Assessment is a certain percentage of the fair market value that is determined by local assessors to be the total taxable value of land and additions on the property. | Land | Improvement |
|---|---|---|---|---|
| 2025 | $3,453 | $348,363 | $67,383 | $280,980 |
| 2024 | $2,744 | $196,748 | $40,836 | $155,912 |
| 2023 | $2,577 | $196,748 | $40,836 | $155,912 |
| 2022 | $2,518 | $196,748 | $40,836 | $155,912 |
| 2021 | $2,506 | $196,748 | $40,836 | $155,912 |
| 2020 | $2,447 | $196,748 | $40,836 | $155,912 |
| 2019 | $2,447 | $196,748 | $40,836 | $155,912 |
| 2018 | $2,457 | $181,093 | $42,640 | $138,453 |
| 2017 | $2,438 | $181,093 | $42,640 | $138,453 |
| 2016 | $2,356 | $181,093 | $42,640 | $138,453 |
| 2015 | $2,566 | $185,382 | $36,948 | $148,434 |
| 2014 | $2,566 | $185,382 | $36,948 | $148,434 |
Source: Public Records
Map
Nearby Homes
- 501 Bellmeade Bay Dr
- 604 Bellmeade Bay Dr
- 411 Bellmeade Bay Dr
- 615 Southshore Pkwy
- 4 Jarvis Ct
- 3908 Holder Rd
- 701 Painted Daisy Ln
- 3023 Allamore Dr
- 3013 Allamore Dr
- 907 Danbury Dr
- 601 Crossing Dr
- 928 Danbury Dr
- 110 Kindlewood Dr
- 210 Stoney Creek Cir
- 442 Gus Rd
- 1107 High Fox Dr
- 407 Glenview Ln
- 107 Crosswood Dr
- 610 Sherron Rd
- 1015 Sora Way
- 6 Marsh Landing Ct
- 4 Marsh Landing Ct
- 12 Marsh Landing Ct
- 2 Marsh Landing Ct
- 505 Bellmeade Bay Dr
- 809 Southshore Pkwy
- 807 Southshore Pkwy
- 5 Marsh Landing Ct
- 7 Marsh Landing Ct
- 603 Bellmeade Bay Dr
- 9 Marsh Landing Ct
- 807 Southshore Pkwy
- 503 Bellmeade Bay Dr
- 805 Southshore Pkwy
- 811 Southshore Pkwy
- 605 Bellmeade Bay Dr
- 803 Southshore Pkwy
- SS231 Southshore Pkwy
- SS236 Southshore Pkwy
- SS266 Southshore Pkwy
Your Personal Tour Guide
Ask me questions while you tour the home.