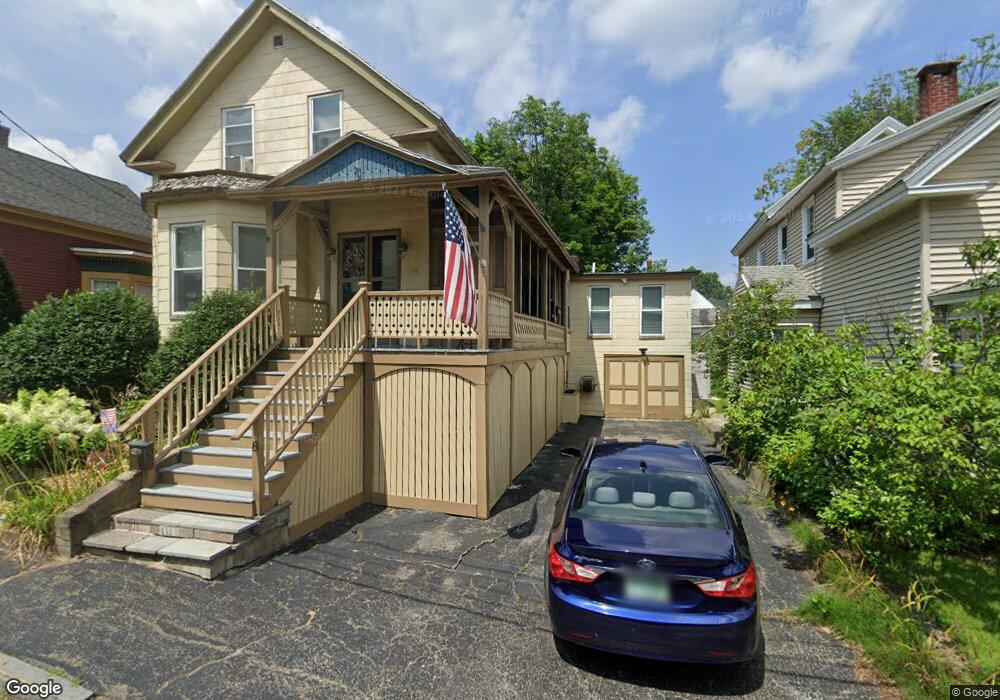
8 Marshall St Concord, NH 03301
South End NeighborhoodEstimated Value: $300,772 - $448,000
3
Beds
1
Bath
1,392
Sq Ft
$280/Sq Ft
Est. Value
About This Home
This home is located at 8 Marshall St, Concord, NH 03301 and is currently estimated at $389,443, approximately $279 per square foot. 8 Marshall St is a home located in Merrimack County with nearby schools including Christa McAuliffe School, Rundlett Middle School, and Concord High School.
Ownership History
Date
Name
Owned For
Owner Type
Purchase Details
Closed on
Apr 25, 2022
Sold by
Smuda James W
Bought by
Smuda James W and Smuda Suzanne P
Current Estimated Value
Home Financials for this Owner
Home Financials are based on the most recent Mortgage that was taken out on this home.
Original Mortgage
$176,000
Outstanding Balance
$164,021
Interest Rate
4.16%
Mortgage Type
Stand Alone Refi Refinance Of Original Loan
Estimated Equity
$225,422
Purchase Details
Closed on
Apr 30, 1992
Bought by
Begin Paula and Smuda James
Create a Home Valuation Report for This Property
The Home Valuation Report is an in-depth analysis detailing your home's value as well as a comparison with similar homes in the area
Home Values in the Area
Average Home Value in this Area
Purchase History
| Date | Buyer | Sale Price | Title Company |
|---|---|---|---|
| Smuda James W | -- | None Available | |
| Begin Paula | $75,000 | -- |
Source: Public Records
Mortgage History
| Date | Status | Borrower | Loan Amount |
|---|---|---|---|
| Open | Smuda James W | $176,000 | |
| Previous Owner | Begin Paula | $187,000 | |
| Previous Owner | Begin Paula | $13,700 |
Source: Public Records
Tax History
| Year | Tax Paid | Tax Assessment Tax Assessment Total Assessment is a certain percentage of the fair market value that is determined by local assessors to be the total taxable value of land and additions on the property. | Land | Improvement |
|---|---|---|---|---|
| 2025 | $6,017 | $206,700 | $88,300 | $118,400 |
| 2024 | $6,305 | $227,700 | $88,300 | $139,400 |
| 2023 | $6,116 | $227,700 | $88,300 | $139,400 |
| 2022 | $5,895 | $227,700 | $88,300 | $139,400 |
| 2021 | $6,313 | $251,300 | $88,300 | $163,000 |
| 2020 | $5,799 | $216,700 | $70,500 | $146,200 |
| 2019 | $5,514 | $198,500 | $65,500 | $133,000 |
| 2018 | $4,975 | $186,200 | $65,500 | $120,700 |
| 2017 | $4,979 | $176,300 | $65,500 | $110,800 |
| 2016 | $4,748 | $171,600 | $65,500 | $106,100 |
| 2015 | $4,435 | $163,600 | $64,200 | $99,400 |
| 2014 | $4,386 | $163,600 | $64,200 | $99,400 |
| 2013 | -- | $162,500 | $64,200 | $98,300 |
| 2012 | -- | $161,700 | $64,200 | $97,500 |
Source: Public Records
Map
Nearby Homes
- 2 S Spring St
- 17-19 Thompson St
- 47 South St
- 58 S State St
- 16 Prince St
- 55 Centre St
- 111 -113 South Main St
- 4 Princeton St
- 10 Ridge Rd
- 9 Forest St
- 24 Ridge Rd
- 20 Cypress St
- 101 Rumford St
- 135 Liberty St
- 273-279 S Main St
- 15 Wyman St Unit 9
- 0 South St Unit 4969509
- 63 Ridge Rd
- 13-15 Walker St
- 335 S Main St
Your Personal Tour Guide
Ask me questions while you tour the home.