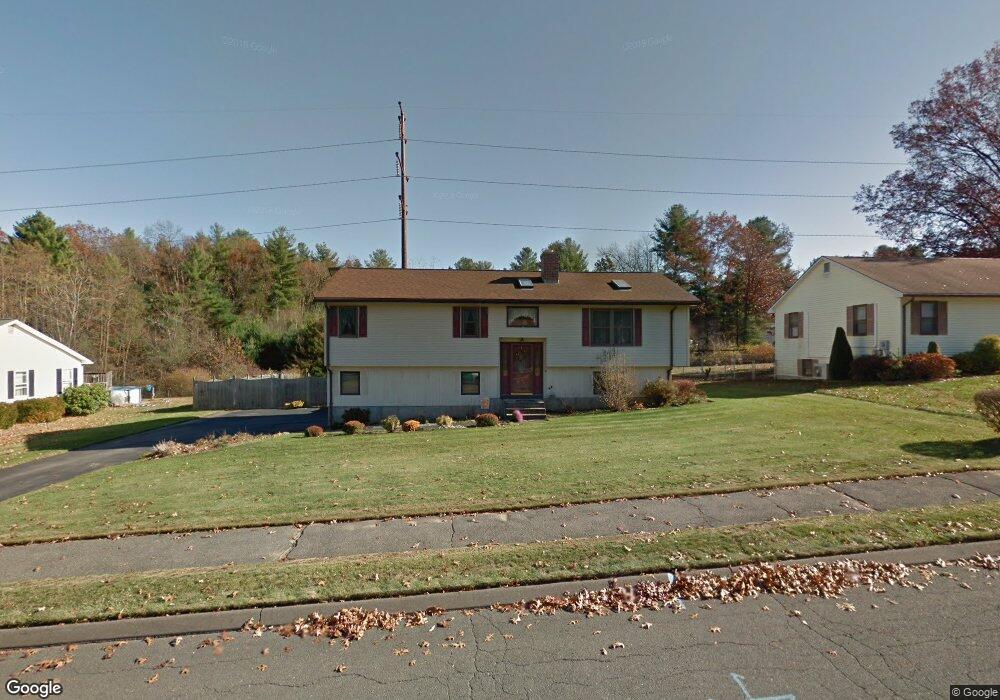
8 Matthew Dr Easthampton, MA 01027
Estimated Value: $387,000 - $479,000
3
Beds
2
Baths
1,242
Sq Ft
$350/Sq Ft
Est. Value
About This Home
This home is located at 8 Matthew Dr, Easthampton, MA 01027 and is currently estimated at $434,129, approximately $349 per square foot. 8 Matthew Dr is a home located in Hampshire County with nearby schools including Easthampton High School, Calvary Baptist Christian School, and Tri-County Schools.
Ownership History
Date
Name
Owned For
Owner Type
Purchase Details
Closed on
Apr 21, 2021
Sold by
Stefanik Thomas J and Stefanik Claire M
Bought by
Menard Laurie A and Stefanik Scott E
Current Estimated Value
Purchase Details
Closed on
Oct 29, 1999
Sold by
Atkins Alice F and Atkins Paul W
Bought by
Stefanik Claire M and Stefanik Thomas J
Home Financials for this Owner
Home Financials are based on the most recent Mortgage that was taken out on this home.
Original Mortgage
$61,000
Interest Rate
7.78%
Mortgage Type
Purchase Money Mortgage
Create a Home Valuation Report for This Property
The Home Valuation Report is an in-depth analysis detailing your home's value as well as a comparison with similar homes in the area
Home Values in the Area
Average Home Value in this Area
Purchase History
| Date | Buyer | Sale Price | Title Company |
|---|---|---|---|
| Menard Laurie A | -- | None Available | |
| Stefanik Claire M | $149,000 | -- |
Source: Public Records
Mortgage History
| Date | Status | Borrower | Loan Amount |
|---|---|---|---|
| Previous Owner | Stefanik Claire M | $61,000 |
Source: Public Records
Tax History Compared to Growth
Tax History
| Year | Tax Paid | Tax Assessment Tax Assessment Total Assessment is a certain percentage of the fair market value that is determined by local assessors to be the total taxable value of land and additions on the property. | Land | Improvement |
|---|---|---|---|---|
| 2025 | $5,450 | $398,700 | $114,900 | $283,800 |
| 2024 | $5,257 | $387,700 | $111,700 | $276,000 |
| 2023 | $3,942 | $269,100 | $87,800 | $181,300 |
| 2022 | $4,448 | $269,100 | $87,800 | $181,300 |
| 2021 | $5,149 | $278,800 | $87,800 | $191,000 |
| 2020 | $4,779 | $269,100 | $87,800 | $181,300 |
| 2019 | $3,910 | $252,900 | $87,800 | $165,100 |
| 2018 | $3,742 | $233,900 | $82,800 | $151,100 |
| 2017 | $3,654 | $225,400 | $79,600 | $145,800 |
| 2016 | $3,514 | $225,400 | $79,600 | $145,800 |
| 2015 | $3,415 | $225,400 | $79,600 | $145,800 |
Source: Public Records
Map
Nearby Homes