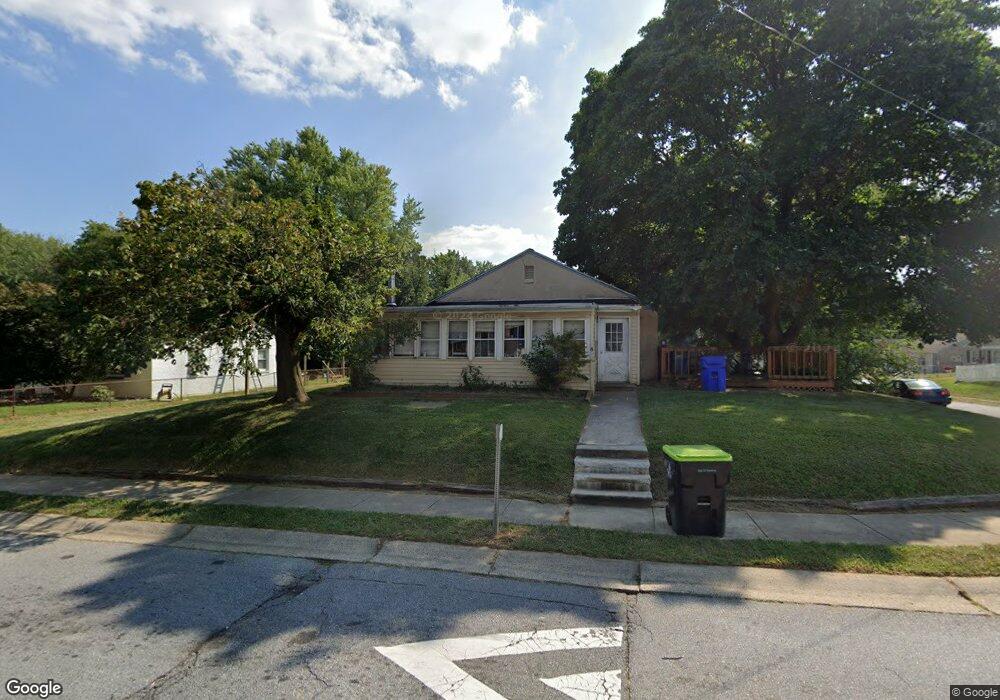
8 May Ave New Castle, DE 19720
Estimated Value: $217,000 - $268,000
3
Beds
1
Bath
1,088
Sq Ft
$222/Sq Ft
Est. Value
About This Home
This home is located at 8 May Ave, New Castle, DE 19720 and is currently estimated at $242,005, approximately $222 per square foot. 8 May Ave is a home located in New Castle County with nearby schools including New Castle Elementary School, Calvin R. McCullough Middle School, and Charter School of New Castle.
Ownership History
Date
Name
Owned For
Owner Type
Purchase Details
Closed on
Oct 6, 2006
Sold by
Taylor Willard F and Taylor Irene E
Bought by
Taylor Willard F
Current Estimated Value
Purchase Details
Closed on
Sep 8, 2003
Sold by
Slattery Charles F and Slattery Sarah Jane
Bought by
Taylor Willard F and Taylor Irene E
Home Financials for this Owner
Home Financials are based on the most recent Mortgage that was taken out on this home.
Original Mortgage
$100,900
Outstanding Balance
$46,743
Interest Rate
6.22%
Mortgage Type
FHA
Estimated Equity
$195,262
Create a Home Valuation Report for This Property
The Home Valuation Report is an in-depth analysis detailing your home's value as well as a comparison with similar homes in the area
Home Values in the Area
Average Home Value in this Area
Purchase History
| Date | Buyer | Sale Price | Title Company |
|---|---|---|---|
| Taylor Willard F | -- | None Available | |
| Taylor Willard F | $102,500 | -- |
Source: Public Records
Mortgage History
| Date | Status | Borrower | Loan Amount |
|---|---|---|---|
| Open | Taylor Willard F | $100,900 | |
| Closed | Taylor Willard F | $4,000 |
Source: Public Records
Tax History Compared to Growth
Tax History
| Year | Tax Paid | Tax Assessment Tax Assessment Total Assessment is a certain percentage of the fair market value that is determined by local assessors to be the total taxable value of land and additions on the property. | Land | Improvement |
|---|---|---|---|---|
| 2024 | $1,075 | $31,300 | $5,700 | $25,600 |
| 2023 | $977 | $31,300 | $5,700 | $25,600 |
| 2022 | $1,018 | $31,300 | $5,700 | $25,600 |
| 2021 | $1,017 | $31,300 | $5,700 | $25,600 |
| 2020 | $1,023 | $31,300 | $5,700 | $25,600 |
| 2019 | $1,026 | $31,300 | $5,700 | $25,600 |
| 2018 | $1,003 | $31,300 | $5,700 | $25,600 |
| 2017 | $939 | $31,300 | $5,700 | $25,600 |
| 2016 | $840 | $31,300 | $5,700 | $25,600 |
| 2015 | $839 | $31,300 | $5,700 | $25,600 |
| 2014 | $840 | $31,300 | $5,700 | $25,600 |
Source: Public Records
Map
Nearby Homes