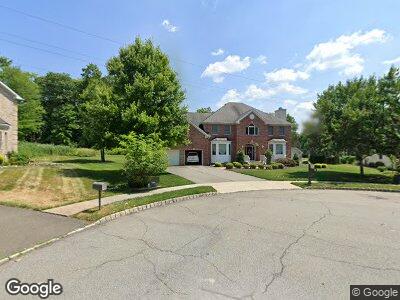
8 Morgan Way East Hanover, NJ 07936
Estimated Value: $1,010,627 - $1,202,000
--
Bed
--
Bath
3,507
Sq Ft
$311/Sq Ft
Est. Value
About This Home
This home is located at 8 Morgan Way, East Hanover, NJ 07936 and is currently estimated at $1,091,907, approximately $311 per square foot. 8 Morgan Way is a home located in Morris County with nearby schools including Frank J. Smith Elementary School, Central Elementary School, and East Hanover Middle School.
Ownership History
Date
Name
Owned For
Owner Type
Purchase Details
Closed on
Apr 27, 2011
Sold by
Spatola Anthony S
Bought by
Farneski Andrew W and Farneski Toni
Current Estimated Value
Home Financials for this Owner
Home Financials are based on the most recent Mortgage that was taken out on this home.
Original Mortgage
$520,000
Interest Rate
4.82%
Mortgage Type
New Conventional
Purchase Details
Closed on
Apr 7, 2005
Sold by
Lincoln Hanover Llc
Bought by
Spatola Anthony S
Home Financials for this Owner
Home Financials are based on the most recent Mortgage that was taken out on this home.
Original Mortgage
$350,000
Interest Rate
5.78%
Mortgage Type
New Conventional
Create a Home Valuation Report for This Property
The Home Valuation Report is an in-depth analysis detailing your home's value as well as a comparison with similar homes in the area
Home Values in the Area
Average Home Value in this Area
Purchase History
| Date | Buyer | Sale Price | Title Company |
|---|---|---|---|
| Farneski Andrew W | $655,000 | Multiple | |
| Spatola Anthony S | $659,900 | -- |
Source: Public Records
Mortgage History
| Date | Status | Borrower | Loan Amount |
|---|---|---|---|
| Open | Farneski Andrew W | $100,000 | |
| Open | Farneski Andrew | $500,000 | |
| Closed | Farneski Andrew W | $512,000 | |
| Closed | Farneski Andrew W | $520,000 | |
| Previous Owner | Spatola Anthony S | $350,000 |
Source: Public Records
Tax History Compared to Growth
Tax History
| Year | Tax Paid | Tax Assessment Tax Assessment Total Assessment is a certain percentage of the fair market value that is determined by local assessors to be the total taxable value of land and additions on the property. | Land | Improvement |
|---|---|---|---|---|
| 2024 | $11,801 | $473,000 | $183,100 | $289,900 |
| 2023 | $11,801 | $473,000 | $183,100 | $289,900 |
| 2022 | $11,532 | $473,000 | $183,100 | $289,900 |
| 2021 | $11,532 | $473,000 | $183,100 | $289,900 |
| 2020 | $11,305 | $473,000 | $183,100 | $289,900 |
| 2019 | $11,097 | $473,000 | $183,100 | $289,900 |
| 2018 | $10,761 | $473,000 | $183,100 | $289,900 |
| 2017 | $10,411 | $473,000 | $183,100 | $289,900 |
| 2016 | $10,269 | $473,000 | $183,100 | $289,900 |
| 2015 | $10,122 | $473,000 | $183,100 | $289,900 |
| 2014 | $9,905 | $473,000 | $183,100 | $289,900 |
Source: Public Records
Map
Nearby Homes
- 1A Ivy Ct
- 3 Raquel Ct
- 47 Heritage Dr
- 140 Mckinley Ave
- 32 Dartmoor Rd
- 83 Ventura Dr Unit 67
- 5 Young Ct
- 48 Eastwood Terrace
- 14 Rohn St
- 3 Eastwood Terrace
- 67 Ventura Dr
- 95 Ventura Dr
- 48 Surrey Ln
- 30 Mckinley Ave
- 69 Ventura Dr
- 55 Ventura Dr Unit 55
- 1107 Pointe Gate Dr
- 1108 Pointe Gate Dr
- 1104 Pointe Gate Dr
- 3104 Pointe Gate Dr