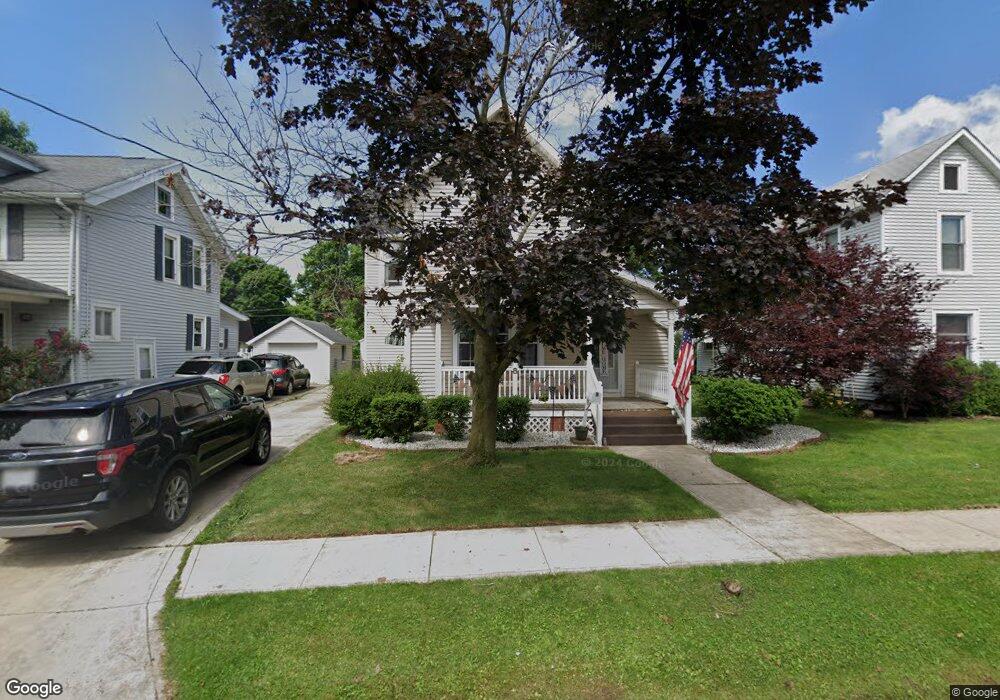
8 Myers Ave Shelby, OH 44875
Estimated Value: $164,000 - $203,000
4
Beds
2
Baths
1,831
Sq Ft
$103/Sq Ft
Est. Value
About This Home
This home is located at 8 Myers Ave, Shelby, OH 44875 and is currently estimated at $189,097, approximately $103 per square foot. 8 Myers Ave is a home located in Richland County with nearby schools including St. Mary's School.
Ownership History
Date
Name
Owned For
Owner Type
Purchase Details
Closed on
Nov 13, 2007
Sold by
Mcbee Bradd D and Mcbee Tammy L
Bought by
Mcbee Brad D and Mcbee Tammy L
Current Estimated Value
Home Financials for this Owner
Home Financials are based on the most recent Mortgage that was taken out on this home.
Original Mortgage
$99,500
Outstanding Balance
$63,246
Interest Rate
6.47%
Mortgage Type
New Conventional
Estimated Equity
$125,851
Purchase Details
Closed on
Jun 4, 2004
Sold by
Seaman Robert E
Bought by
Mcbee Brad D
Home Financials for this Owner
Home Financials are based on the most recent Mortgage that was taken out on this home.
Original Mortgage
$95,000
Interest Rate
5.99%
Mortgage Type
Purchase Money Mortgage
Create a Home Valuation Report for This Property
The Home Valuation Report is an in-depth analysis detailing your home's value as well as a comparison with similar homes in the area
Home Values in the Area
Average Home Value in this Area
Purchase History
| Date | Buyer | Sale Price | Title Company |
|---|---|---|---|
| Mcbee Brad D | -- | Southern Title | |
| Mcbee Brad D | $95,000 | Southern Title |
Source: Public Records
Mortgage History
| Date | Status | Borrower | Loan Amount |
|---|---|---|---|
| Open | Mcbee Brad D | $99,500 | |
| Closed | Mcbee Brad D | $95,000 |
Source: Public Records
Tax History Compared to Growth
Tax History
| Year | Tax Paid | Tax Assessment Tax Assessment Total Assessment is a certain percentage of the fair market value that is determined by local assessors to be the total taxable value of land and additions on the property. | Land | Improvement |
|---|---|---|---|---|
| 2024 | $1,754 | $45,910 | $4,800 | $41,110 |
| 2023 | $1,754 | $45,910 | $4,800 | $41,110 |
| 2022 | $1,668 | $39,050 | $4,850 | $34,200 |
| 2021 | $1,669 | $39,050 | $4,850 | $34,200 |
| 2020 | $1,670 | $39,050 | $4,850 | $34,200 |
| 2019 | $1,552 | $33,280 | $4,120 | $29,160 |
| 2018 | $1,537 | $33,280 | $4,120 | $29,160 |
| 2017 | $1,522 | $33,280 | $4,120 | $29,160 |
| 2016 | $1,447 | $31,850 | $3,910 | $27,940 |
| 2015 | $1,447 | $31,850 | $3,910 | $27,940 |
| 2014 | $1,391 | $31,850 | $3,910 | $27,940 |
| 2012 | $720 | $33,530 | $4,120 | $29,410 |
Source: Public Records
Map
Nearby Homes