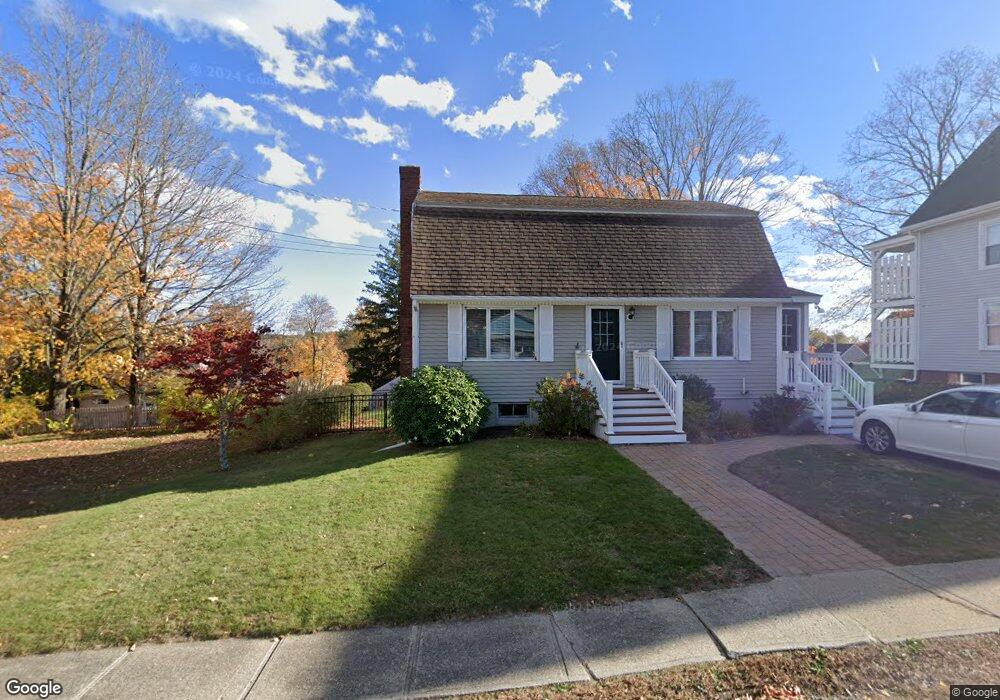
8 Myrtle St Amesbury, MA 01913
Estimated Value: $626,000 - $688,000
3
Beds
3
Baths
1,588
Sq Ft
$418/Sq Ft
Est. Value
About This Home
This home is located at 8 Myrtle St, Amesbury, MA 01913 and is currently estimated at $663,289, approximately $417 per square foot. 8 Myrtle St is a home located in Essex County with nearby schools including Amesbury High School and Amesbury Seventh-Day Adventist School.
Ownership History
Date
Name
Owned For
Owner Type
Purchase Details
Closed on
Mar 20, 1996
Sold by
Webber David J and Webber Leslie
Bought by
Cashman Michael
Current Estimated Value
Home Financials for this Owner
Home Financials are based on the most recent Mortgage that was taken out on this home.
Original Mortgage
$133,000
Interest Rate
6.99%
Mortgage Type
Purchase Money Mortgage
Purchase Details
Closed on
Dec 18, 1987
Sold by
Hodge Herbert P
Bought by
Webber David J
Create a Home Valuation Report for This Property
The Home Valuation Report is an in-depth analysis detailing your home's value as well as a comparison with similar homes in the area
Home Values in the Area
Average Home Value in this Area
Purchase History
| Date | Buyer | Sale Price | Title Company |
|---|---|---|---|
| Cashman Michael | $140,000 | -- | |
| Webber David J | $150,000 | -- |
Source: Public Records
Mortgage History
| Date | Status | Borrower | Loan Amount |
|---|---|---|---|
| Open | Webber David J | $198,000 | |
| Closed | Webber David J | $206,500 | |
| Closed | Webber David J | $170,000 | |
| Closed | Webber David J | $133,000 |
Source: Public Records
Tax History Compared to Growth
Tax History
| Year | Tax Paid | Tax Assessment Tax Assessment Total Assessment is a certain percentage of the fair market value that is determined by local assessors to be the total taxable value of land and additions on the property. | Land | Improvement |
|---|---|---|---|---|
| 2025 | $8,104 | $529,700 | $199,200 | $330,500 |
| 2024 | $7,732 | $494,400 | $187,900 | $306,500 |
| 2023 | $7,078 | $433,200 | $163,400 | $269,800 |
| 2022 | $6,777 | $383,100 | $142,100 | $241,000 |
| 2021 | $5,999 | $328,700 | $109,700 | $219,000 |
| 2020 | $5,329 | $310,200 | $105,500 | $204,700 |
| 2019 | $5,414 | $294,700 | $105,500 | $189,200 |
| 2018 | $5,209 | $274,300 | $100,500 | $173,800 |
| 2017 | $5,349 | $268,100 | $100,500 | $167,600 |
| 2016 | $5,303 | $261,500 | $100,500 | $161,000 |
| 2015 | $5,209 | $253,600 | $100,500 | $153,100 |
| 2014 | $5,085 | $242,500 | $100,500 | $142,000 |
Source: Public Records
Map
Nearby Homes
- 3 Brown Ave Unit 75
- 1 Brown Ave Unit 3-80
- 57 Clinton St
- 3 Glenwood St
- 1 Stacey Ln
- 2 Locke Hill Ln
- 105 Market St Unit B
- 103 Market St Unit A
- 103 Market St Unit B
- 101 Market St Unit B
- 101 Market St Unit A
- 25 Cedar St Unit 4
- 25 Cedar St Unit 7
- 21 Woodman Rd
- 48 Orchard St
- 100 Congress St
- 7 Melrose St
- 53 Market St
- 17 Linwood Place
- 97 Elm St