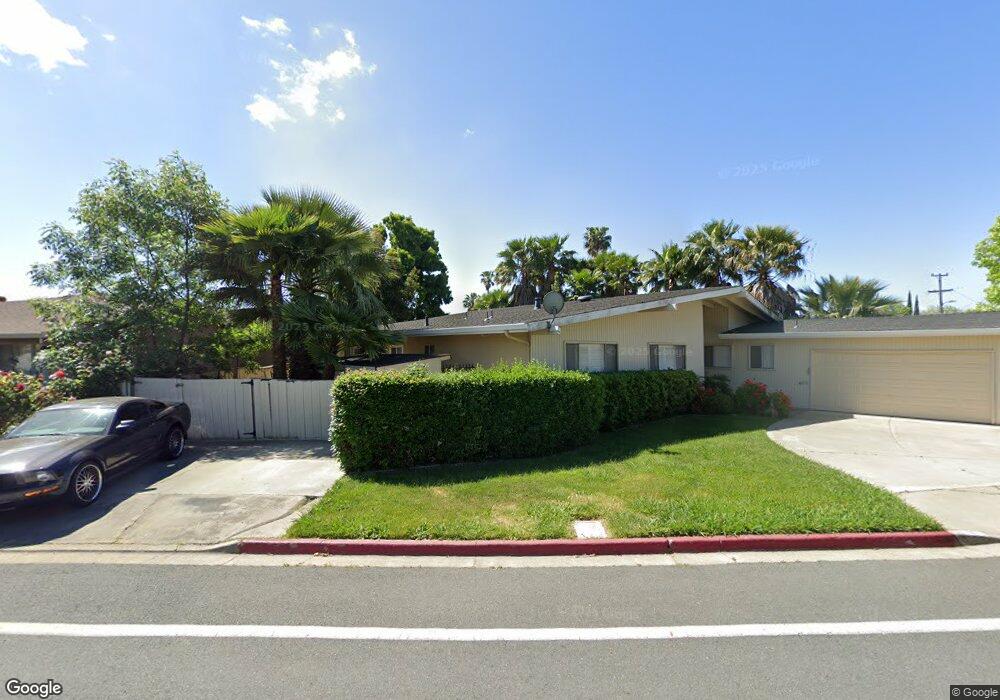
8 N Lake Dr Antioch, CA 94509
North Antioch NeighborhoodEstimated Value: $551,000 - $684,000
4
Beds
3
Baths
2,258
Sq Ft
$268/Sq Ft
Est. Value
About This Home
This home is located at 8 N Lake Dr, Antioch, CA 94509 and is currently estimated at $606,095, approximately $268 per square foot. 8 N Lake Dr is a home located in Contra Costa County with nearby schools including Kimball Elementary School, Antioch Middle School, and Antioch High School.
Ownership History
Date
Name
Owned For
Owner Type
Purchase Details
Closed on
May 21, 2008
Sold by
Washington Mutual Bank
Bought by
Shornikov Dmitriy
Current Estimated Value
Home Financials for this Owner
Home Financials are based on the most recent Mortgage that was taken out on this home.
Original Mortgage
$200,000
Outstanding Balance
$124,120
Interest Rate
5.5%
Mortgage Type
Purchase Money Mortgage
Estimated Equity
$481,975
Purchase Details
Closed on
Feb 19, 2008
Sold by
Perez Mercedes
Bought by
Washington Mutual Bank
Purchase Details
Closed on
Nov 9, 2005
Sold by
Perez Mercedes
Bought by
Real Estate Network Solutions Llc
Home Financials for this Owner
Home Financials are based on the most recent Mortgage that was taken out on this home.
Original Mortgage
$100,000
Interest Rate
6.12%
Mortgage Type
Purchase Money Mortgage
Purchase Details
Closed on
Sep 23, 2005
Sold by
Haro Aurelio
Bought by
Perez Mercedes
Home Financials for this Owner
Home Financials are based on the most recent Mortgage that was taken out on this home.
Original Mortgage
$100,000
Interest Rate
6.12%
Mortgage Type
Purchase Money Mortgage
Purchase Details
Closed on
Jan 6, 2005
Sold by
Tang Kim N
Bought by
Tran Vananh
Purchase Details
Closed on
Oct 25, 2004
Sold by
Johnson Charles and Davi Frank R
Bought by
Sullivan Jody
Home Financials for this Owner
Home Financials are based on the most recent Mortgage that was taken out on this home.
Original Mortgage
$364,000
Interest Rate
7.32%
Mortgage Type
Purchase Money Mortgage
Purchase Details
Closed on
Aug 13, 2003
Sold by
Davi Frank and Johnson Charles
Bought by
Johnson Charles and Davi Frank R
Purchase Details
Closed on
Jul 5, 2002
Sold by
Ryan James Lisle and Ryan John Michael
Bought by
Lo Victor
Home Financials for this Owner
Home Financials are based on the most recent Mortgage that was taken out on this home.
Original Mortgage
$268,350
Interest Rate
6.69%
Mortgage Type
Purchase Money Mortgage
Create a Home Valuation Report for This Property
The Home Valuation Report is an in-depth analysis detailing your home's value as well as a comparison with similar homes in the area
Home Values in the Area
Average Home Value in this Area
Purchase History
| Date | Buyer | Sale Price | Title Company |
|---|---|---|---|
| Shornikov Dmitriy | $250,000 | Chicago Title Company | |
| Washington Mutual Bank | $251,000 | Servicelink | |
| Real Estate Network Solutions Llc | -- | None Available | |
| Perez Mercedes | -- | Fidelity National Title | |
| Perez Mercedes | $595,000 | Fidelity National Title | |
| Tran Vananh | -- | Fidelity National Title | |
| Tran Vananh | $30,000 | Fidelity National Title | |
| Sullivan Jody | $455,000 | First American Title | |
| Johnson Charles | -- | -- | |
| Lo Victor | $282,500 | First American Title Guarant |
Source: Public Records
Mortgage History
| Date | Status | Borrower | Loan Amount |
|---|---|---|---|
| Open | Shornikov Dmitriy | $200,000 | |
| Previous Owner | Real Estate Network Solutions Llc | $100,000 | |
| Previous Owner | Perez Mercedes | $476,000 | |
| Previous Owner | Sullivan Jody | $364,000 | |
| Previous Owner | Lo Victor | $268,350 | |
| Closed | Sullivan Jody | $91,000 |
Source: Public Records
Tax History Compared to Growth
Tax History
| Year | Tax Paid | Tax Assessment Tax Assessment Total Assessment is a certain percentage of the fair market value that is determined by local assessors to be the total taxable value of land and additions on the property. | Land | Improvement |
|---|---|---|---|---|
| 2025 | $4,137 | $328,364 | $52,532 | $275,832 |
| 2024 | $4,028 | $321,926 | $51,502 | $270,424 |
| 2023 | $4,028 | $315,615 | $50,493 | $265,122 |
| 2022 | $3,968 | $309,427 | $49,503 | $259,924 |
| 2021 | $3,812 | $303,361 | $48,533 | $254,828 |
| 2019 | $3,764 | $294,366 | $47,095 | $247,271 |
| 2018 | $3,632 | $288,595 | $46,172 | $242,423 |
| 2017 | $3,541 | $282,937 | $45,267 | $237,670 |
| 2016 | $3,461 | $277,390 | $44,380 | $233,010 |
| 2015 | $3,430 | $273,224 | $43,714 | $229,510 |
| 2014 | $3,192 | $255,500 | $40,878 | $214,622 |
Source: Public Records
Map
Nearby Homes