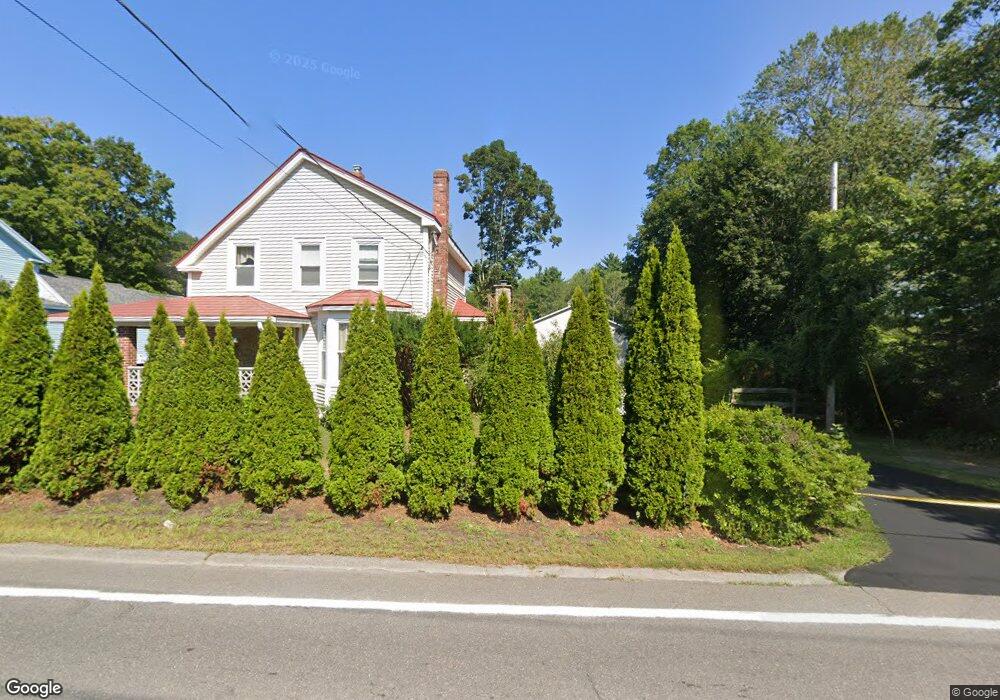
8 N Main St Newton, NH 03858
Estimated Value: $590,000 - $701,870
4
Beds
3
Baths
2,522
Sq Ft
$265/Sq Ft
Est. Value
About This Home
This home is located at 8 N Main St, Newton, NH 03858 and is currently estimated at $668,468, approximately $265 per square foot. 8 N Main St is a home located in Rockingham County with nearby schools including Memorial School, Sanborn Regional Middle School, and Sanborn Regional High School.
Ownership History
Date
Name
Owned For
Owner Type
Purchase Details
Closed on
Jun 22, 2012
Sold by
Currao Salvatore
Bought by
Currao Salvatore J and Currao Jean
Current Estimated Value
Home Financials for this Owner
Home Financials are based on the most recent Mortgage that was taken out on this home.
Original Mortgage
$186,000
Outstanding Balance
$128,965
Interest Rate
3.84%
Mortgage Type
Purchase Money Mortgage
Estimated Equity
$539,503
Purchase Details
Closed on
Oct 4, 2001
Sold by
Toomey Michael K and Toomey Priscilla J
Bought by
Currao Salvatore
Home Financials for this Owner
Home Financials are based on the most recent Mortgage that was taken out on this home.
Original Mortgage
$179,910
Interest Rate
6.89%
Create a Home Valuation Report for This Property
The Home Valuation Report is an in-depth analysis detailing your home's value as well as a comparison with similar homes in the area
Home Values in the Area
Average Home Value in this Area
Purchase History
| Date | Buyer | Sale Price | Title Company |
|---|---|---|---|
| Currao Salvatore J | -- | -- | |
| Currao Salvatore | $199,900 | -- |
Source: Public Records
Mortgage History
| Date | Status | Borrower | Loan Amount |
|---|---|---|---|
| Open | Currao Salvatore J | $186,000 | |
| Previous Owner | Currao Salvatore | $200,000 | |
| Previous Owner | Currao Salvatore | $179,910 |
Source: Public Records
Tax History Compared to Growth
Tax History
| Year | Tax Paid | Tax Assessment Tax Assessment Total Assessment is a certain percentage of the fair market value that is determined by local assessors to be the total taxable value of land and additions on the property. | Land | Improvement |
|---|---|---|---|---|
| 2024 | $11,201 | $441,500 | $133,600 | $307,900 |
| 2023 | $10,865 | $441,500 | $133,600 | $307,900 |
| 2022 | $9,889 | $439,700 | $133,600 | $306,100 |
| 2021 | $9,190 | $439,700 | $133,600 | $306,100 |
| 2020 | $9,127 | $436,700 | $133,600 | $303,100 |
| 2019 | $9,397 | $356,200 | $100,800 | $255,400 |
| 2018 | $9,112 | $356,200 | $100,800 | $255,400 |
| 2017 | $9,468 | $356,200 | $100,800 | $255,400 |
| 2016 | $9,318 | $356,200 | $100,800 | $255,400 |
| 2015 | $8,955 | $342,200 | $100,800 | $241,400 |
| 2014 | $8,957 | $345,300 | $100,800 | $244,500 |
| 2013 | $8,736 | $345,300 | $100,800 | $244,500 |
Source: Public Records
Map
Nearby Homes
- 7 Grebenstein Dr
- 5 Audrey Ln
- 17 Maple Ave
- 56 Whittier St
- 43 Maple Ave
- 8 Chongor Dr
- 155 Chase Rd
- 7 Ashley Ln
- 4 Quaker St
- 4 Currier St
- 21 Currier St
- 18 Harriman Rd
- 21 Marcoux Rd
- 62 & 43 Wilders Grove Rd
- 2 Country Pond Rd
- 5 Wentworth Dr
- 15 Bootland Farm Rd
- 25 Crane Crossing Rd
- 21 W Shore Park Rd
- 9 Bowley Rd