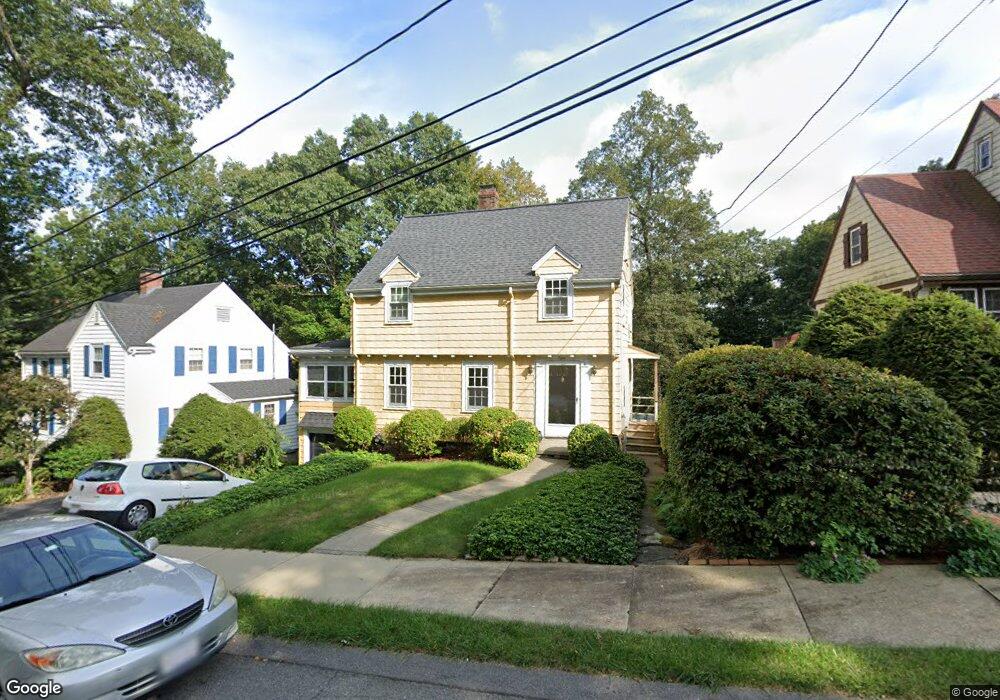
8 Newcomb Rd Stoneham, MA 02180
Haywardville NeighborhoodEstimated Value: $798,000 - $849,410
3
Beds
2
Baths
1,289
Sq Ft
$637/Sq Ft
Est. Value
About This Home
This home is located at 8 Newcomb Rd, Stoneham, MA 02180 and is currently estimated at $820,853, approximately $636 per square foot. 8 Newcomb Rd is a home located in Middlesex County with nearby schools including Stoneham High School, Melrose Montessori School, and St Mary's School.
Ownership History
Date
Name
Owned For
Owner Type
Purchase Details
Closed on
Oct 28, 2011
Sold by
Todd Marion J
Bought by
Prentice Jason R and Prentice Jennifer M
Current Estimated Value
Home Financials for this Owner
Home Financials are based on the most recent Mortgage that was taken out on this home.
Original Mortgage
$240,000
Outstanding Balance
$164,366
Interest Rate
4.11%
Mortgage Type
Purchase Money Mortgage
Estimated Equity
$656,487
Create a Home Valuation Report for This Property
The Home Valuation Report is an in-depth analysis detailing your home's value as well as a comparison with similar homes in the area
Home Values in the Area
Average Home Value in this Area
Purchase History
| Date | Buyer | Sale Price | Title Company |
|---|---|---|---|
| Prentice Jason R | $340,000 | -- |
Source: Public Records
Mortgage History
| Date | Status | Borrower | Loan Amount |
|---|---|---|---|
| Open | Prentice Jason R | $240,000 |
Source: Public Records
Tax History
| Year | Tax Paid | Tax Assessment Tax Assessment Total Assessment is a certain percentage of the fair market value that is determined by local assessors to be the total taxable value of land and additions on the property. | Land | Improvement |
|---|---|---|---|---|
| 2025 | $7,352 | $718,700 | $396,000 | $322,700 |
| 2024 | $6,954 | $656,700 | $360,000 | $296,700 |
| 2023 | $6,686 | $602,300 | $324,000 | $278,300 |
| 2022 | $5,919 | $568,600 | $306,000 | $262,600 |
| 2021 | $5,851 | $540,800 | $282,200 | $258,600 |
| 2020 | $5,717 | $529,800 | $267,500 | $262,300 |
| 2019 | $5,731 | $510,800 | $279,700 | $231,100 |
| 2018 | $5,636 | $481,300 | $250,800 | $230,500 |
| 2017 | $5,495 | $443,500 | $231,400 | $212,100 |
| 2016 | $4,923 | $387,600 | $191,500 | $196,100 |
| 2015 | $4,929 | $380,300 | $191,500 | $188,800 |
| 2014 | $4,802 | $356,000 | $175,600 | $180,400 |
Source: Public Records
Map
Nearby Homes
- 35 Maple Rd
- 53 Perkins St
- 62 Maple St
- 300 Park Terrace Dr Unit 354
- 6 Colby Terrace
- 601 Franklin St Unit 2
- 24 Ellsworth Ave
- 43-51 Albion St Unit C9
- 23 Ellsworth Ave
- 37 S High St
- 33 Lake Ave
- 104 Cottage St
- 49 Melrose St Unit 1F
- 51 Melrose St Unit 1C
- 51 Melrose St Unit 1A
- 62 Cottage St
- 129 Greenwood St
- 159 Franklin St Unit D2
- 159 Franklin St Unit C2
- 159 Franklin St Unit E6
Your Personal Tour Guide
Ask me questions while you tour the home.