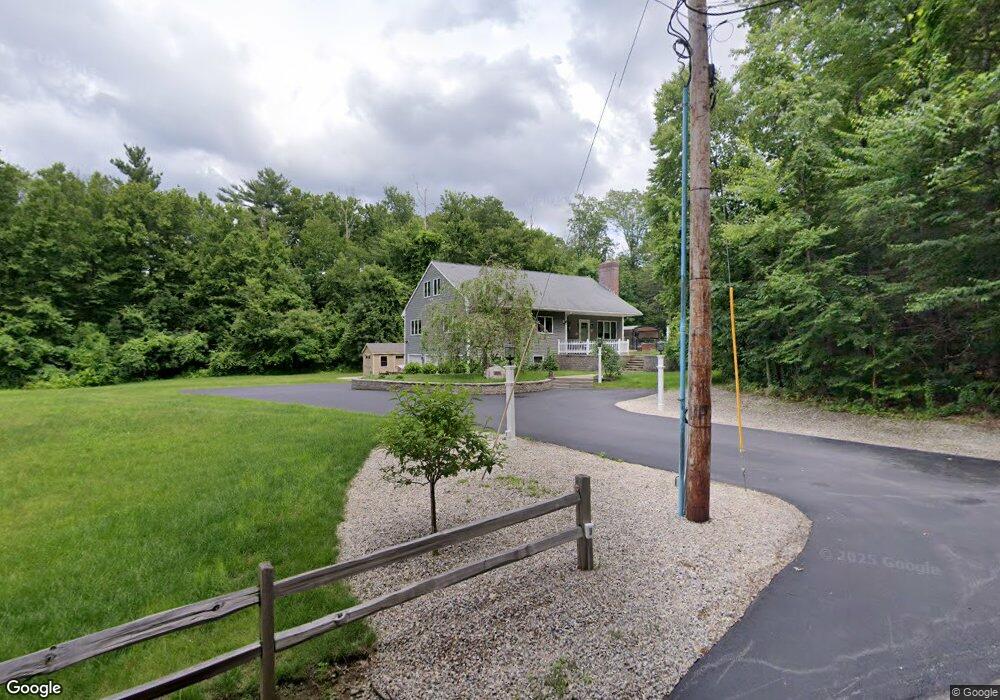
8 Newton Dr Sutton, MA 01590
Estimated Value: $664,000 - $790,000
3
Beds
3
Baths
2,280
Sq Ft
$324/Sq Ft
Est. Value
About This Home
This home is located at 8 Newton Dr, Sutton, MA 01590 and is currently estimated at $739,493, approximately $324 per square foot. 8 Newton Dr is a home located in Worcester County with nearby schools including Sutton Elementary School, Sutton Middle School, and Sutton High School.
Ownership History
Date
Name
Owned For
Owner Type
Purchase Details
Closed on
Jun 1, 2020
Sold by
Dahlin Paul R
Bought by
Dahlin Lynn B and Langlois Jason
Current Estimated Value
Home Financials for this Owner
Home Financials are based on the most recent Mortgage that was taken out on this home.
Original Mortgage
$333,000
Outstanding Balance
$295,729
Interest Rate
3.3%
Mortgage Type
New Conventional
Estimated Equity
$443,764
Purchase Details
Closed on
Nov 30, 2001
Sold by
Beaudin Briand J and Beaudoin Cynthia J
Bought by
Dahlin Pau Lr and Dahlin Lynn B
Purchase Details
Closed on
Sep 25, 1998
Sold by
Est Shaw Kenneth M and Shaw Pauline P
Bought by
Beaudin Briand J and Beaudin Cynthia J
Home Financials for this Owner
Home Financials are based on the most recent Mortgage that was taken out on this home.
Original Mortgage
$42,000
Interest Rate
6.87%
Mortgage Type
Purchase Money Mortgage
Create a Home Valuation Report for This Property
The Home Valuation Report is an in-depth analysis detailing your home's value as well as a comparison with similar homes in the area
Home Values in the Area
Average Home Value in this Area
Purchase History
| Date | Buyer | Sale Price | Title Company |
|---|---|---|---|
| Dahlin Lynn B | $417,000 | None Available | |
| Dahlin Pau Lr | $87,500 | -- | |
| Beaudin Briand J | $70,000 | -- |
Source: Public Records
Mortgage History
| Date | Status | Borrower | Loan Amount |
|---|---|---|---|
| Open | Dahlin Lynn B | $333,000 | |
| Previous Owner | Beaudin Briand J | $42,000 |
Source: Public Records
Tax History
| Year | Tax Paid | Tax Assessment Tax Assessment Total Assessment is a certain percentage of the fair market value that is determined by local assessors to be the total taxable value of land and additions on the property. | Land | Improvement |
|---|---|---|---|---|
| 2025 | $7,871 | $654,800 | $199,100 | $455,700 |
| 2024 | $7,726 | $609,300 | $183,500 | $425,800 |
| 2023 | $8,023 | $579,300 | $166,700 | $412,600 |
| 2022 | $6,998 | $461,000 | $127,700 | $333,300 |
| 2021 | $7,182 | $448,900 | $127,700 | $321,200 |
| 2020 | $6,820 | $430,000 | $127,700 | $302,300 |
| 2019 | $6,649 | $402,500 | $127,700 | $274,800 |
| 2018 | $6,395 | $386,400 | $127,700 | $258,700 |
| 2017 | $6,230 | $377,600 | $112,500 | $265,100 |
| 2016 | $6,138 | $368,000 | $112,500 | $255,500 |
| 2015 | $5,923 | $355,100 | $112,500 | $242,600 |
| 2014 | $5,879 | $348,300 | $118,300 | $230,000 |
Source: Public Records
Map
Nearby Homes
- 15 Westview Dr
- 354 W Sutton Rd
- 345 W Sutton Rd
- 29 Winwood Rd
- 63 Uxbridge Rd
- 1 Burbank Rd
- 5 Hamlets Way
- 99 Burbank Rd
- 99 Burbank Road Lot 182
- 7 Fuller Rd
- 11 Laurel Dr
- 31 Central Turnpike
- 51 Central Turnpike
- 109 Mendon Rd
- 168 Burbank Rd
- 28 Brierly Cir
- 186 8 Lots Rd
- 192 Horne Way Unit 192
- 57 Horne Way Unit 57
- 265 Mendon Rd
- 30 Maple Ln
- 51 Merriam Ln
- 24 Maple Ln
- Lot 3 Putnam Hill Rd
- LOT 43 Brookside Dr
- LOT 2K Smith Rd
- LOT 3 Stevens Way
- LOT 69 Boundary Stone Rd
- L-6A Tipperary Dr
- L55 Stonebridge Farms
- LOT 4 Dewitt Rd
- LOT 54 Trilliam Run
- LOT 3 Steven Way
- LOT 5 Olivia Ln
- Unit 48 Ariel Cir Unit 48
- LOT 5A Buttonwood Ave
- 12 Newton Dr
- 36 Maple Ln
- 27 Maple Ln
- 25 Maple Ln