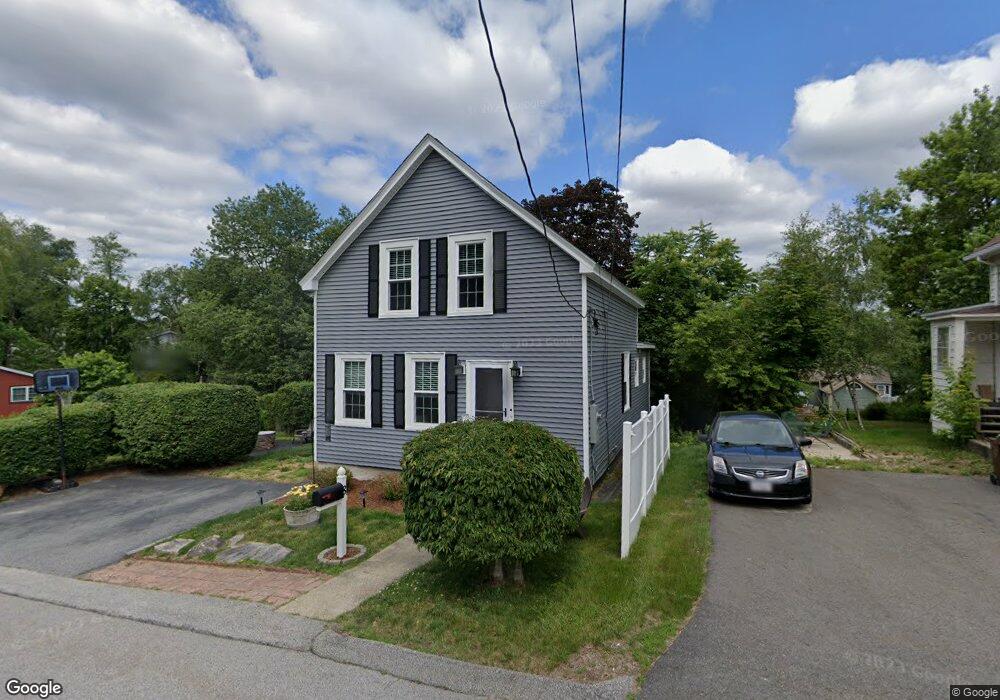
8 Newton St Auburn, MA 01501
Pakachoag NeighborhoodEstimated Value: $360,833 - $403,000
5
Beds
2
Baths
1,291
Sq Ft
$303/Sq Ft
Est. Value
About This Home
This home is located at 8 Newton St, Auburn, MA 01501 and is currently estimated at $391,708, approximately $303 per square foot. 8 Newton St is a home located in Worcester County with nearby schools including Auburn Senior High School, Canterbury Street School, and St Peter Central Catholic Elementary School.
Ownership History
Date
Name
Owned For
Owner Type
Purchase Details
Closed on
Mar 19, 2024
Sold by
Berube Dawn M
Bought by
Allard Martin L and Allard Dawn M
Current Estimated Value
Purchase Details
Closed on
Jun 7, 2013
Sold by
Mitchell Robert A
Bought by
Berube Dawn M
Purchase Details
Closed on
Aug 20, 1974
Bought by
Mitchell Robert A
Create a Home Valuation Report for This Property
The Home Valuation Report is an in-depth analysis detailing your home's value as well as a comparison with similar homes in the area
Home Values in the Area
Average Home Value in this Area
Purchase History
| Date | Buyer | Sale Price | Title Company |
|---|---|---|---|
| Allard Martin L | -- | None Available | |
| Berube Dawn M | -- | -- | |
| Mitchell Robert A | -- | -- |
Source: Public Records
Mortgage History
| Date | Status | Borrower | Loan Amount |
|---|---|---|---|
| Previous Owner | Mitchell Robert A | $15,000 |
Source: Public Records
Tax History
| Year | Tax Paid | Tax Assessment Tax Assessment Total Assessment is a certain percentage of the fair market value that is determined by local assessors to be the total taxable value of land and additions on the property. | Land | Improvement |
|---|---|---|---|---|
| 2025 | $4,158 | $291,000 | $109,100 | $181,900 |
| 2024 | $4,089 | $273,900 | $103,900 | $170,000 |
| 2023 | $4,049 | $255,000 | $94,500 | $160,500 |
| 2022 | $3,848 | $228,800 | $94,500 | $134,300 |
| 2021 | $2,832 | $156,100 | $83,400 | $72,700 |
| 2020 | $5,057 | $151,800 | $83,400 | $68,400 |
| 2019 | $4,764 | $155,600 | $78,200 | $77,400 |
| 2018 | $2,679 | $145,300 | $73,100 | $72,200 |
| 2017 | $2,498 | $136,200 | $66,300 | $69,900 |
| 2016 | $2,538 | $140,300 | $69,500 | $70,800 |
| 2015 | $2,396 | $138,800 | $69,500 | $69,300 |
| 2014 | $2,338 | $135,200 | $66,100 | $69,100 |
Source: Public Records
Map
Nearby Homes
- 34 Preston Ave
- 1034 Southbridge St
- 35 Hampton St
- 204-212 Hampton St
- 154 Pakachoag St
- 6 Epworth St
- 50 Sophia Dr
- 22 Bittersweet Blvd
- 73 Sophia Dr
- 5 Clarendon Rd
- 29 Steele St
- 4 Stockholm St
- 50 Whipple St
- 99 Clover St
- 407 Cambridge St Unit 1
- 14-14 1/2 Hacker St
- 30 Ekman St
- 29 Tatman St
- 56 Richards St
- 52 Richards St
Your Personal Tour Guide
Ask me questions while you tour the home.