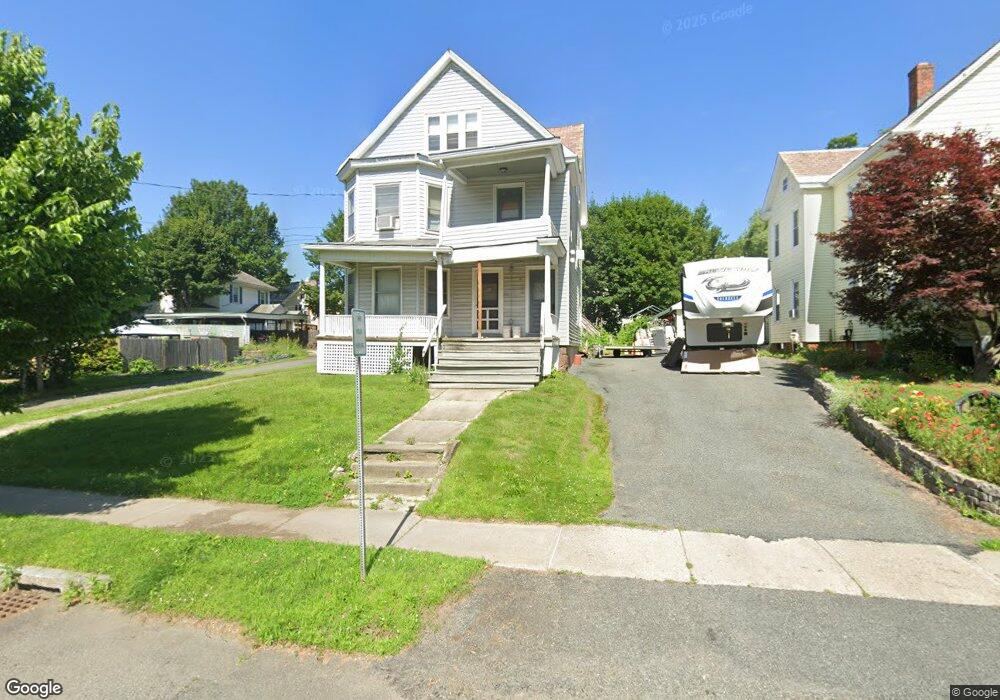
8 North St Unit 10 Greenfield, MA 01301
Estimated Value: $273,000 - $730,933
5
Beds
3
Baths
3,190
Sq Ft
$134/Sq Ft
Est. Value
About This Home
This home is located at 8 North St Unit 10, Greenfield, MA 01301 and is currently estimated at $426,483, approximately $133 per square foot. 8 North St Unit 10 is a home located in Franklin County with nearby schools including Holy Trinity School and Cornerstone Christian School.
Ownership History
Date
Name
Owned For
Owner Type
Purchase Details
Closed on
Aug 15, 1989
Sold by
Birdsong H Robert
Bought by
Hohengasser Herbert F
Current Estimated Value
Home Financials for this Owner
Home Financials are based on the most recent Mortgage that was taken out on this home.
Original Mortgage
$100,000
Interest Rate
9.93%
Mortgage Type
Purchase Money Mortgage
Purchase Details
Closed on
Apr 10, 1987
Sold by
Falk George
Bought by
Chin Gan Howe
Home Financials for this Owner
Home Financials are based on the most recent Mortgage that was taken out on this home.
Original Mortgage
$141,000
Interest Rate
9.02%
Mortgage Type
Purchase Money Mortgage
Create a Home Valuation Report for This Property
The Home Valuation Report is an in-depth analysis detailing your home's value as well as a comparison with similar homes in the area
Home Values in the Area
Average Home Value in this Area
Purchase History
| Date | Buyer | Sale Price | Title Company |
|---|---|---|---|
| Hohengasser Herbert F | $172,500 | -- | |
| Chin Gan Howe | $141,000 | -- |
Source: Public Records
Mortgage History
| Date | Status | Borrower | Loan Amount |
|---|---|---|---|
| Closed | Chin Gan Howe | $100,000 | |
| Previous Owner | Chin Gan Howe | $141,000 |
Source: Public Records
Tax History
| Year | Tax Paid | Tax Assessment Tax Assessment Total Assessment is a certain percentage of the fair market value that is determined by local assessors to be the total taxable value of land and additions on the property. | Land | Improvement |
|---|---|---|---|---|
| 2025 | $5,297 | $270,800 | $65,200 | $205,600 |
| 2024 | $5,224 | $256,200 | $52,300 | $203,900 |
| 2023 | $5,013 | $253,600 | $52,300 | $201,300 |
| 2022 | $4,649 | $208,300 | $47,300 | $161,000 |
| 2021 | $4,454 | $191,800 | $47,000 | $144,800 |
| 2020 | $4,302 | $187,600 | $42,800 | $144,800 |
| 2019 | $4,070 | $182,000 | $37,200 | $144,800 |
| 2018 | $3,995 | $178,100 | $36,500 | $141,600 |
| 2017 | $3,870 | $178,100 | $36,500 | $141,600 |
| 2016 | $3,908 | $179,200 | $35,100 | $144,100 |
| 2015 | $3,872 | $172,000 | $39,300 | $132,700 |
| 2014 | $3,531 | $172,000 | $39,300 | $132,700 |
Source: Public Records
Map
Nearby Homes
Your Personal Tour Guide
Ask me questions while you tour the home.