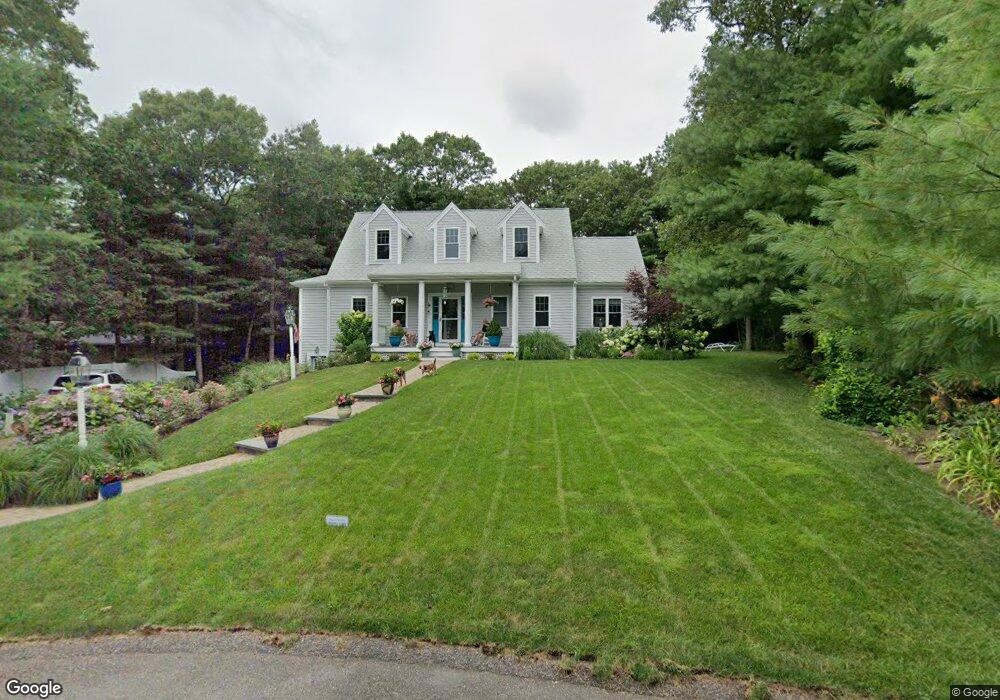
8 Oak Ridge Pocasset, MA 02559
Pocasset NeighborhoodEstimated Value: $774,736 - $818,000
4
Beds
4
Baths
2,088
Sq Ft
$384/Sq Ft
Est. Value
About This Home
This home is located at 8 Oak Ridge, Pocasset, MA 02559 and is currently estimated at $801,934, approximately $384 per square foot. 8 Oak Ridge is a home located in Barnstable County with nearby schools including Bourne High School, Cadence Academy Preschool - Bourne, and St Margaret Regional School.
Ownership History
Date
Name
Owned For
Owner Type
Purchase Details
Closed on
Jun 2, 2020
Sold by
Linsky James R and Linsky Joan S
Bought by
Linsky Joan S and Linsky James R
Current Estimated Value
Purchase Details
Closed on
Apr 16, 2014
Sold by
Rossides Gale and Myzie Gale R
Bought by
Linsky James R and Linsky Joan S
Home Financials for this Owner
Home Financials are based on the most recent Mortgage that was taken out on this home.
Original Mortgage
$358,760
Interest Rate
4.26%
Mortgage Type
New Conventional
Create a Home Valuation Report for This Property
The Home Valuation Report is an in-depth analysis detailing your home's value as well as a comparison with similar homes in the area
Home Values in the Area
Average Home Value in this Area
Purchase History
| Date | Buyer | Sale Price | Title Company |
|---|---|---|---|
| Linsky Joan S | -- | None Available | |
| Linsky Joan S | -- | None Available | |
| Linsky James R | $134,500 | -- | |
| Linsky James R | $134,500 | -- |
Source: Public Records
Mortgage History
| Date | Status | Borrower | Loan Amount |
|---|---|---|---|
| Previous Owner | Linsky James R | $358,760 |
Source: Public Records
Tax History Compared to Growth
Tax History
| Year | Tax Paid | Tax Assessment Tax Assessment Total Assessment is a certain percentage of the fair market value that is determined by local assessors to be the total taxable value of land and additions on the property. | Land | Improvement |
|---|---|---|---|---|
| 2025 | $5,375 | $688,200 | $198,400 | $489,800 |
| 2024 | $5,331 | $664,700 | $198,400 | $466,300 |
| 2023 | $5,221 | $592,600 | $175,600 | $417,000 |
| 2022 | $4,942 | $489,800 | $155,400 | $334,400 |
| 2021 | $4,836 | $449,000 | $141,400 | $307,600 |
| 2020 | $4,566 | $425,100 | $140,100 | $285,000 |
| 2019 | $4,328 | $411,800 | $140,100 | $271,700 |
| 2018 | $4,134 | $392,200 | $133,400 | $258,800 |
| 2017 | $4,001 | $388,400 | $132,200 | $256,200 |
| 2016 | $3,759 | $370,000 | $125,900 | $244,100 |
| 2015 | $1,268 | $125,900 | $125,900 | $0 |
Source: Public Records
Map
Nearby Homes
- 254 Barlows Landing Rd
- 940 County Rd
- 709 County Rd
- 7 4th Ave
- 15 1st St
- 171 Bellavista Dr
- 39 Bennets Neck Dr
- 940 County Rd
- 14 Navajo Rd
- 34 Kenwood Rd
- 70 Wings Neck Rd
- 45 Kenwood Rd
- 22 Nairn Rd
- 41 Portside Dr
- 3 Red Brook Pond Dr
- 515 County Rd
- 48 Red Brook Harbor Rd
- 566 Shore Rd
- 30 Howard Ave
- 93 Valley Bars Rd