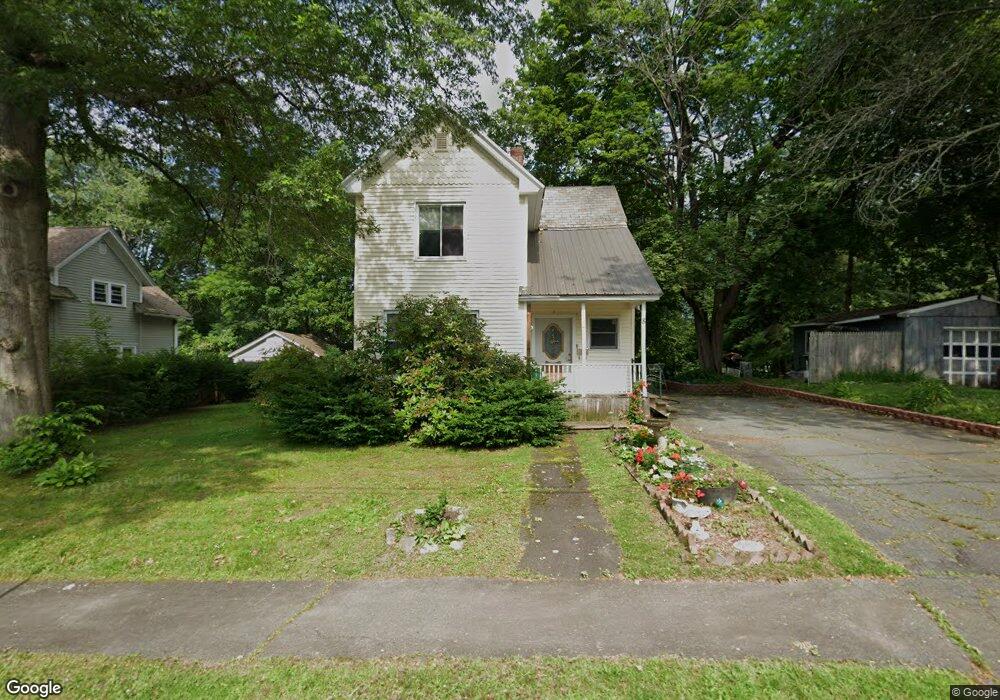
8 Oak St Greenfield, MA 01301
Estimated Value: $265,000 - $382,000
3
Beds
2
Baths
1,922
Sq Ft
$167/Sq Ft
Est. Value
About This Home
This home is located at 8 Oak St, Greenfield, MA 01301 and is currently estimated at $320,596, approximately $166 per square foot. 8 Oak St is a home located in Franklin County with nearby schools including Holy Trinity School and Cornerstone Christian School.
Ownership History
Date
Name
Owned For
Owner Type
Purchase Details
Closed on
Jul 30, 1993
Sold by
Puffer Suzanne L
Bought by
Bernaski Gerald W and Bernaski Kum Ok Lee
Current Estimated Value
Home Financials for this Owner
Home Financials are based on the most recent Mortgage that was taken out on this home.
Original Mortgage
$72,650
Interest Rate
7.32%
Mortgage Type
Purchase Money Mortgage
Create a Home Valuation Report for This Property
The Home Valuation Report is an in-depth analysis detailing your home's value as well as a comparison with similar homes in the area
Home Values in the Area
Average Home Value in this Area
Purchase History
| Date | Buyer | Sale Price | Title Company |
|---|---|---|---|
| Bernaski Gerald W | $76,500 | -- | |
| Bernaski Gerald W | $76,500 | -- |
Source: Public Records
Mortgage History
| Date | Status | Borrower | Loan Amount |
|---|---|---|---|
| Open | Bernaski Gerald W | $132,000 | |
| Closed | Bernaski Gerald W | $105,600 | |
| Closed | Bernaski Gerald W | $42,126 | |
| Closed | Bernaski Gerald W | $72,650 |
Source: Public Records
Tax History Compared to Growth
Tax History
| Year | Tax Paid | Tax Assessment Tax Assessment Total Assessment is a certain percentage of the fair market value that is determined by local assessors to be the total taxable value of land and additions on the property. | Land | Improvement |
|---|---|---|---|---|
| 2025 | $4,818 | $246,300 | $67,700 | $178,600 |
| 2024 | $4,798 | $235,300 | $54,300 | $181,000 |
| 2023 | $4,170 | $212,200 | $54,300 | $157,900 |
| 2022 | $3,886 | $174,100 | $49,200 | $124,900 |
| 2021 | $3,743 | $161,200 | $48,800 | $112,400 |
| 2020 | $3,504 | $152,800 | $44,500 | $108,300 |
| 2019 | $3,285 | $146,900 | $38,600 | $108,300 |
| 2018 | $3,237 | $144,300 | $37,900 | $106,400 |
| 2017 | $3,136 | $144,300 | $37,900 | $106,400 |
| 2016 | $3,114 | $142,800 | $36,400 | $106,400 |
| 2015 | $3,129 | $139,000 | $40,800 | $98,200 |
| 2014 | $2,856 | $139,100 | $40,800 | $98,300 |
Source: Public Records
Map
Nearby Homes