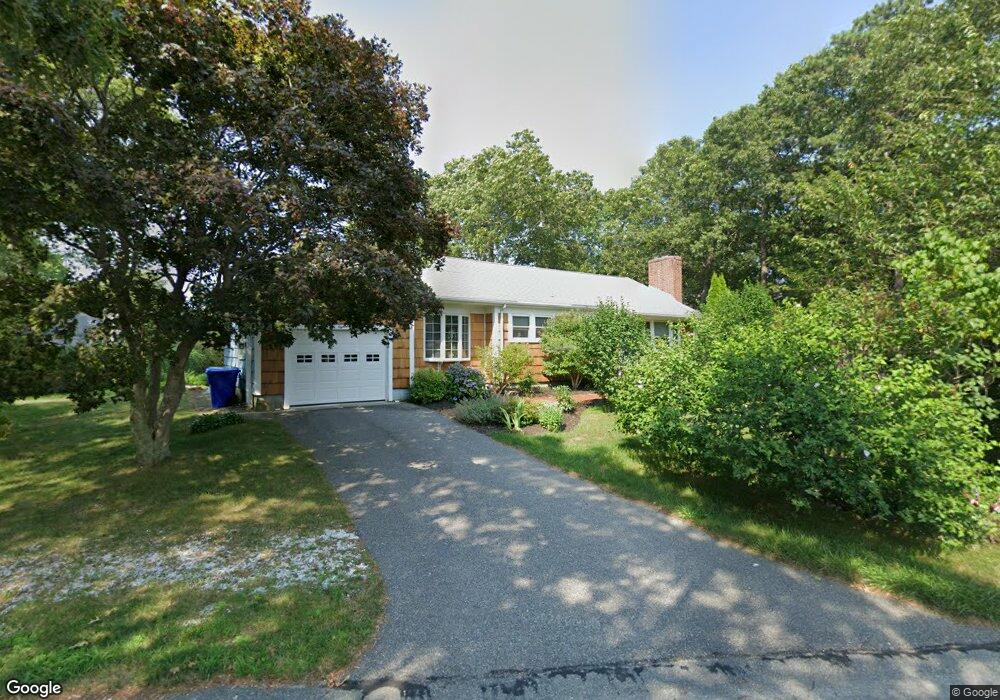
8 Olney Rd Bourne, MA 2532
Estimated Value: $491,000 - $598,000
2
Beds
1
Bath
995
Sq Ft
$539/Sq Ft
Est. Value
About This Home
This home is located at 8 Olney Rd, Bourne, MA 2532 and is currently estimated at $536,623, approximately $539 per square foot. 8 Olney Rd is a home located in Barnstable County with nearby schools including Bourne High School, St Margaret Regional School, and Cadence Academy Preschool - Bourne.
Ownership History
Date
Name
Owned For
Owner Type
Purchase Details
Closed on
Apr 9, 2023
Sold by
Orphanos Elaine D
Bought by
Eomd T T and Eomd Orphanos
Current Estimated Value
Purchase Details
Closed on
Jun 27, 2005
Sold by
Kelson Sheila M
Bought by
Orphanos Elaine D
Home Financials for this Owner
Home Financials are based on the most recent Mortgage that was taken out on this home.
Original Mortgage
$205,000
Interest Rate
5.82%
Mortgage Type
Purchase Money Mortgage
Create a Home Valuation Report for This Property
The Home Valuation Report is an in-depth analysis detailing your home's value as well as a comparison with similar homes in the area
Purchase History
| Date | Buyer | Sale Price | Title Company |
|---|---|---|---|
| Eomd T T | -- | None Available | |
| Eomd T T | -- | None Available | |
| Orphanos Elaine D | $341,000 | -- | |
| Orphanos Elaine D | $341,000 | -- |
Source: Public Records
Mortgage History
| Date | Status | Borrower | Loan Amount |
|---|---|---|---|
| Previous Owner | Orphanos Elaine D | $205,000 |
Source: Public Records
Tax History
| Year | Tax Paid | Tax Assessment Tax Assessment Total Assessment is a certain percentage of the fair market value that is determined by local assessors to be the total taxable value of land and additions on the property. | Land | Improvement |
|---|---|---|---|---|
| 2025 | $3,593 | $460,000 | $246,800 | $213,200 |
| 2024 | $3,514 | $438,100 | $235,100 | $203,000 |
| 2023 | $3,415 | $387,600 | $208,000 | $179,600 |
| 2022 | $3,296 | $326,700 | $184,100 | $142,600 |
| 2021 | $3,203 | $297,400 | $167,600 | $129,800 |
| 2020 | $3,103 | $288,900 | $166,000 | $122,900 |
| 2019 | $3,157 | $300,400 | $184,400 | $116,000 |
| 2018 | $2,958 | $280,600 | $175,600 | $105,000 |
| 2017 | $2,863 | $278,000 | $174,000 | $104,000 |
| 2016 | $2,439 | $240,100 | $156,600 | $83,500 |
| 2015 | $2,184 | $216,900 | $133,400 | $83,500 |
Source: Public Records
Map
Nearby Homes
- 60 Bourne Neck Dr
- 35 Benedict Rd
- 5 Zoli Ln
- 46 Holt Rd Unit B
- 46 Holt Rd
- 203 County Rd
- 13 Laurel Hill Ct
- 40-A Lafayette Ave
- 44 Cotuit Rd
- 4 Van Bummel Rd
- 2 Applewood Ct
- 5 Sea Knoll Ct
- 56 Rip Van Winkle Way
- 60 Sandwich Rd
- 12 Turnberry Rd Unit 12
- 38 Old Bridge Rd
- 3 Honora Ln Unit 3
- 6 Honora Ct
- 4 Hollyhock Knoll Ct Unit 4
- 4 Hollyhock Knoll Ct Unit 4
Your Personal Tour Guide
Ask me questions while you tour the home.