
Seller's Agent in 2016
Joseph Porricelli
Coldwell Banker Realty
(203) 515-6310
3 Total Sales
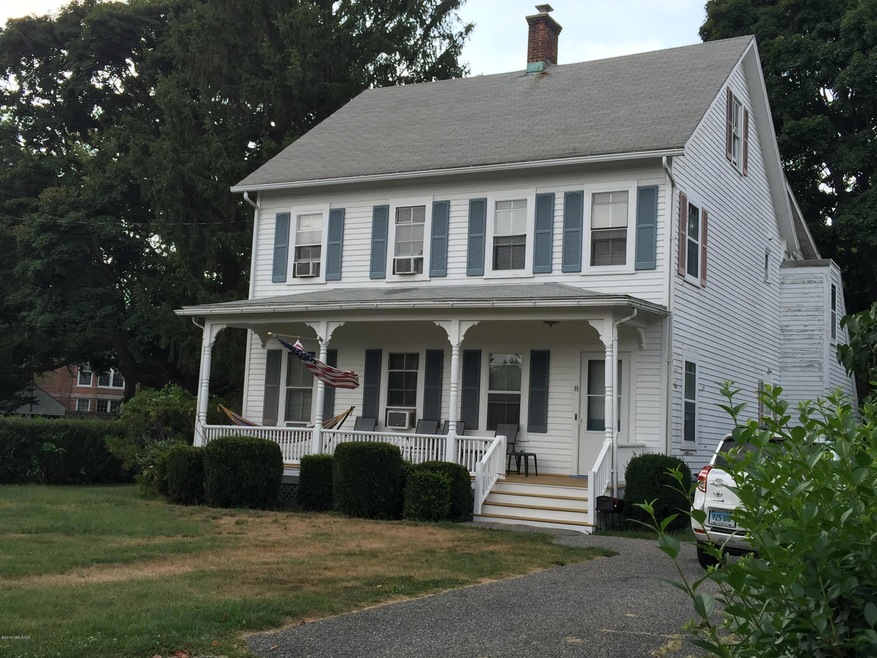
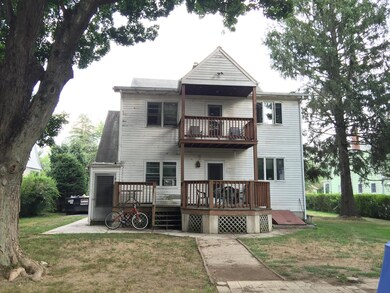
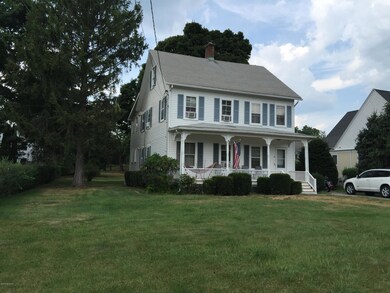
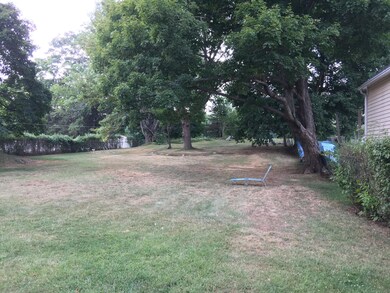
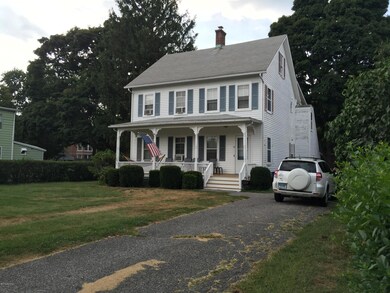
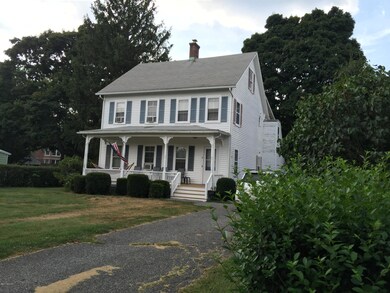
This home is located at 8 Orchard St, Cos Cob, CT 06807 and is currently priced at $775,000, approximately $275 per square foot. This property was built in 1893. 8 Orchard St is a home located in Fairfield County with nearby schools including Cos Cob School, Central Middle School, and Greenwich High School.
Last Agent to Sell the Property
Dorothy Darlington
William Raveis Real Estate Listed on: 09/11/2015
Home Type
Multi-Family
Est. Annual Taxes
$8,270
Year Built
1893
Lot Details
0
Listing Details
Interior Features
Exterior Features
Utilities
Schools
Lot Info
Multi Family
Tax Info
| Date | Type | Sale Price | Title Company |
|---|---|---|---|
| Deed | $581,250 | -- | |
| Deed | $775,000 | -- |
| Date | Status | Loan Amount | Loan Type |
|---|---|---|---|
| Open | $536,000 | Balloon |
| Date | Event | Price | Change | Sq Ft Price |
|---|---|---|---|---|
| 04/29/2016 04/29/16 | Rented | $2,600 | 0.0% | -- |
| 04/29/2016 04/29/16 | Under Contract | -- | -- | -- |
| 04/29/2016 04/29/16 | Rented | $2,600 | -12.6% | -- |
| 03/30/2016 03/30/16 | Under Contract | -- | -- | -- |
| 02/15/2016 02/15/16 | For Rent | $2,975 | 0.0% | -- |
| 01/29/2016 01/29/16 | For Rent | $2,975 | 0.0% | -- |
| 12/24/2015 12/24/15 | Sold | $775,000 | -48.3% | $275 / Sq Ft |
| 10/31/2015 10/31/15 | Pending | -- | -- | -- |
| 09/11/2015 09/11/15 | For Sale | $1,498,000 | -- | $532 / Sq Ft |
| Year | Tax Paid | Tax Assessment Tax Assessment Total Assessment is a certain percentage of the fair market value that is determined by local assessors to be the total taxable value of land and additions on the property. | Land | Improvement |
|---|---|---|---|---|
| 2025 | $8,270 | $669,130 | $414,050 | $255,080 |
| 2024 | $7,987 | $669,130 | $414,050 | $255,080 |
| 2023 | $7,786 | $669,130 | $414,050 | $255,080 |
| 2022 | $7,715 | $669,130 | $414,050 | $255,080 |
| 2021 | $6,484 | $538,510 | $337,400 | $201,110 |
| 2020 | $5,732 | $476,910 | $337,400 | $139,510 |
| 2019 | $5,790 | $476,910 | $337,400 | $139,510 |
| 2018 | $5,899 | $476,910 | $337,400 | $139,510 |
| 2017 | $5,732 | $476,910 | $337,400 | $139,510 |
| 2016 | $5,513 | $466,060 | $337,400 | $128,660 |
| 2015 | $5,510 | $464,450 | $393,470 | $70,980 |
| 2014 | $5,481 | $471,520 | $400,540 | $70,980 |
Seller's Agent in 2016
Joseph Porricelli
Coldwell Banker Realty
(203) 515-6310
3 Total Sales
Seller's Agent in 2016
Kelly Feda
Coldwell Banker Realty
(203) 536-0361
6 in this area
46 Total Sales
Buyer's Agent in 2016
Joanne Tambascio
Coldwell Banker Realty
2 in this area
25 Total Sales
D
Seller's Agent in 2015
Dorothy Darlington
William Raveis Real Estate
Source: Greenwich Association of REALTORS®
MLS Number: 94536
APN: GREE-000008-000000-001606-S000000
Disclaimer: Certain information contained herein is derived from information provided by parties other than Homes.com. All information provided is deemed reliable, but is not guaranteed to be accurate and should be independently verified.
![]() Listing data courtesy of Greenwich MLS. IDX information is provided exclusively for consumers’ personal, non-commercial use, that it may not be used for any purpose other than to
Listing data courtesy of Greenwich MLS. IDX information is provided exclusively for consumers’ personal, non-commercial use, that it may not be used for any purpose other than to
identify prospective properties consumers may be interested in purchasing. Data is deemed reliable but is not guaranteed accurate by the MLS.