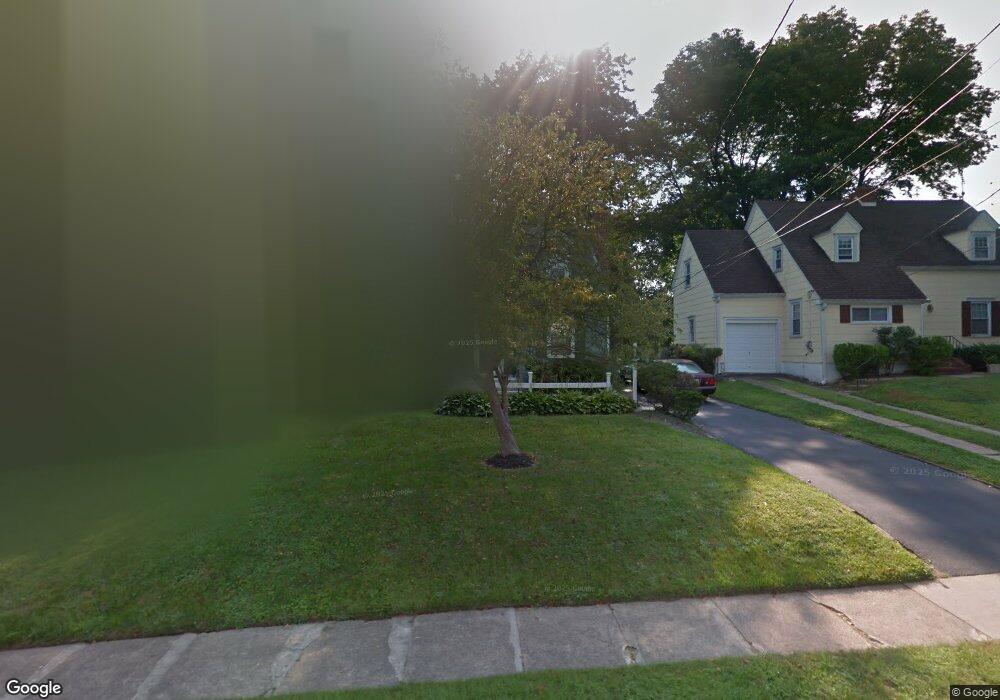
8 Pershing Ave Ewing, NJ 08618
Glendale NeighborhoodEstimated Value: $335,741 - $403,000
Studio
--
Bath
1,584
Sq Ft
$237/Sq Ft
Est. Value
About This Home
This home is located at 8 Pershing Ave, Ewing, NJ 08618 and is currently estimated at $374,685, approximately $236 per square foot. 8 Pershing Ave is a home located in Mercer County with nearby schools including Ewing High School and Trenton Stem-To-Civics Charter School.
Ownership History
Date
Name
Owned For
Owner Type
Purchase Details
Closed on
Apr 13, 2006
Current Estimated Value
Purchase Details
Closed on
Oct 29, 1999
Sold by
Stranieri Kenneth
Bought by
Graham Timothy
Home Financials for this Owner
Home Financials are based on the most recent Mortgage that was taken out on this home.
Original Mortgage
$141,928
Interest Rate
7.73%
Mortgage Type
FHA
Purchase Details
Closed on
Apr 22, 1994
Sold by
Petersen Christopher
Bought by
Stranieri Kenneth and Stranieri Lona
Home Financials for this Owner
Home Financials are based on the most recent Mortgage that was taken out on this home.
Original Mortgage
$125,000
Interest Rate
7.7%
Purchase Details
Closed on
Apr 14, 1992
Sold by
Sindlinger Matthew P and Sindlinger Lisa C
Bought by
Peterson Christopher and Peterson Catherine
Purchase Details
Closed on
Oct 6, 1988
Sold by
Chatten Joan B
Bought by
Sindlinger Matthew P
Create a Home Valuation Report for This Property
The Home Valuation Report is an in-depth analysis detailing your home's value as well as a comparison with similar homes in the area
Home Values in the Area
Average Home Value in this Area
Purchase History
| Date | Buyer | Sale Price | Title Company |
|---|---|---|---|
| -- | -- | -- | |
| Graham Timothy | $142,000 | -- | |
| Stranieri Kenneth | $139,000 | -- | |
| Peterson Christopher | $123,500 | -- | |
| Sindlinger Matthew P | $135,000 | -- |
Source: Public Records
Mortgage History
| Date | Status | Borrower | Loan Amount |
|---|---|---|---|
| Previous Owner | Graham Timothy | $141,928 | |
| Previous Owner | Stranieri Kenneth | $125,000 |
Source: Public Records
Tax History
| Year | Tax Paid | Tax Assessment Tax Assessment Total Assessment is a certain percentage of the fair market value that is determined by local assessors to be the total taxable value of land and additions on the property. | Land | Improvement |
|---|---|---|---|---|
| 2025 | $8,232 | $221,800 | $64,400 | $157,400 |
| 2024 | $7,738 | $209,300 | $64,400 | $144,900 |
| 2023 | $7,738 | $209,300 | $64,400 | $144,900 |
| 2022 | $7,529 | $209,300 | $64,400 | $144,900 |
| 2021 | $7,344 | $209,300 | $64,400 | $144,900 |
| 2020 | $7,240 | $209,300 | $64,400 | $144,900 |
| 2019 | $7,051 | $209,300 | $64,400 | $144,900 |
| 2018 | $6,381 | $120,800 | $45,900 | $74,900 |
| 2017 | $6,529 | $120,800 | $45,900 | $74,900 |
| 2016 | $6,441 | $120,800 | $45,900 | $74,900 |
| 2015 | $6,355 | $120,800 | $45,900 | $74,900 |
| 2014 | $6,338 | $120,800 | $45,900 | $74,900 |
Source: Public Records
Map
Nearby Homes
- 5 Pershing Ave
- 1410 Pennington Rd
- 268 Weber Ave
- 35 Rosedale Ave
- 257 Homecrest Ave
- 2 Mccarthy Dr
- 643 Concord Cir
- 124 New Hillcrest Ave
- 584 Parkway Ave
- 644 Parkway Ave
- 0 Beechwood Dr Unit NJME2058552
- 318 Gardner Ave
- 330 Beechwood Ave
- 108 Homecrest Ave
- 111 Huff Ave
- 100 Homecrest Ave
- 318 Beechwood Ave
- 213 Oliver Ave
- 116 Oliver Ave
- 34 Arlington Ave
- 6 Pershing Ave
- 4 Pershing Ave
- 12 Pershing Ave
- 2 Pershing Ave
- 14 Pershing Ave
- 91 Pickford Ave
- 1423 Pennington Rd
- 1203 Parkside Ave
- 11 Pershing Ave
- 7 Pickford Ave
- 15 Pershing Ave
- 1453 Pennington Rd
- 17 Pershing Ave
- 3 Pershing Ave
- 96 Pickford Ave
- 1 Pershing Ave
- 1457 Pennington Rd
- 1202 Parkside Ave
- 1405 Pennington Rd Unit 2B
- 1405 Pennington Rd Unit 1B
Your Personal Tour Guide
Ask me questions while you tour the home.