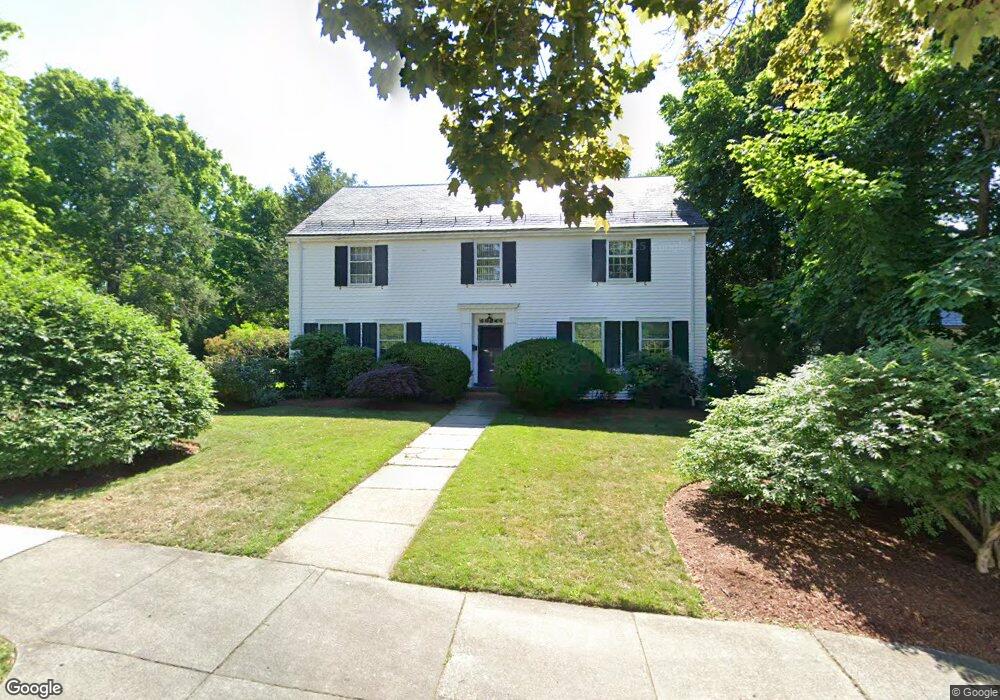
8 Pickwick Rd West Newton, MA 02465
West Newton NeighborhoodEstimated Value: $2,524,875 - $3,285,000
6
Beds
6
Baths
3,800
Sq Ft
$749/Sq Ft
Est. Value
About This Home
This home is located at 8 Pickwick Rd, West Newton, MA 02465 and is currently estimated at $2,845,219, approximately $748 per square foot. 8 Pickwick Rd is a home located in Middlesex County with nearby schools including Peirce Elementary School, F.A. Day Middle School, and Newton North High School.
Ownership History
Date
Name
Owned For
Owner Type
Purchase Details
Closed on
Sep 21, 2022
Sold by
Berger Thomas and Berger-Ghosh Sucharita
Bought by
Berger-Ghosh Sucharita
Current Estimated Value
Purchase Details
Closed on
Sep 10, 2019
Sold by
Berger Thomas
Bought by
Berger Thomas U and Berger-Ghosh Sucharita
Purchase Details
Closed on
Jun 28, 2001
Sold by
Jablon Sally S and Silver Robert I
Bought by
Berger Peter L and Berger Brigitte
Create a Home Valuation Report for This Property
The Home Valuation Report is an in-depth analysis detailing your home's value as well as a comparison with similar homes in the area
Home Values in the Area
Average Home Value in this Area
Purchase History
| Date | Buyer | Sale Price | Title Company |
|---|---|---|---|
| Berger-Ghosh Sucharita | -- | None Available | |
| Berger Thomas U | -- | -- | |
| Berger Thomas | -- | -- | |
| Berger Peter L | $1,243,800 | -- |
Source: Public Records
Mortgage History
| Date | Status | Borrower | Loan Amount |
|---|---|---|---|
| Previous Owner | Berger Peter L | $351,400 |
Source: Public Records
Tax History Compared to Growth
Tax History
| Year | Tax Paid | Tax Assessment Tax Assessment Total Assessment is a certain percentage of the fair market value that is determined by local assessors to be the total taxable value of land and additions on the property. | Land | Improvement |
|---|---|---|---|---|
| 2025 | $20,776 | $2,120,000 | $1,272,200 | $847,800 |
| 2024 | $20,089 | $2,058,300 | $1,235,100 | $823,200 |
| 2023 | $19,559 | $1,921,300 | $960,000 | $961,300 |
| 2022 | $18,715 | $1,779,000 | $888,900 | $890,100 |
| 2021 | $18,059 | $1,678,300 | $838,600 | $839,700 |
| 2020 | $17,521 | $1,678,300 | $838,600 | $839,700 |
| 2019 | $17,027 | $1,629,400 | $814,200 | $815,200 |
| 2018 | $16,758 | $1,548,800 | $737,000 | $811,800 |
| 2017 | $16,247 | $1,461,100 | $695,300 | $765,800 |
| 2016 | $15,539 | $1,365,500 | $649,800 | $715,700 |
| 2015 | $14,817 | $1,276,200 | $607,300 | $668,900 |
Source: Public Records
Map
Nearby Homes