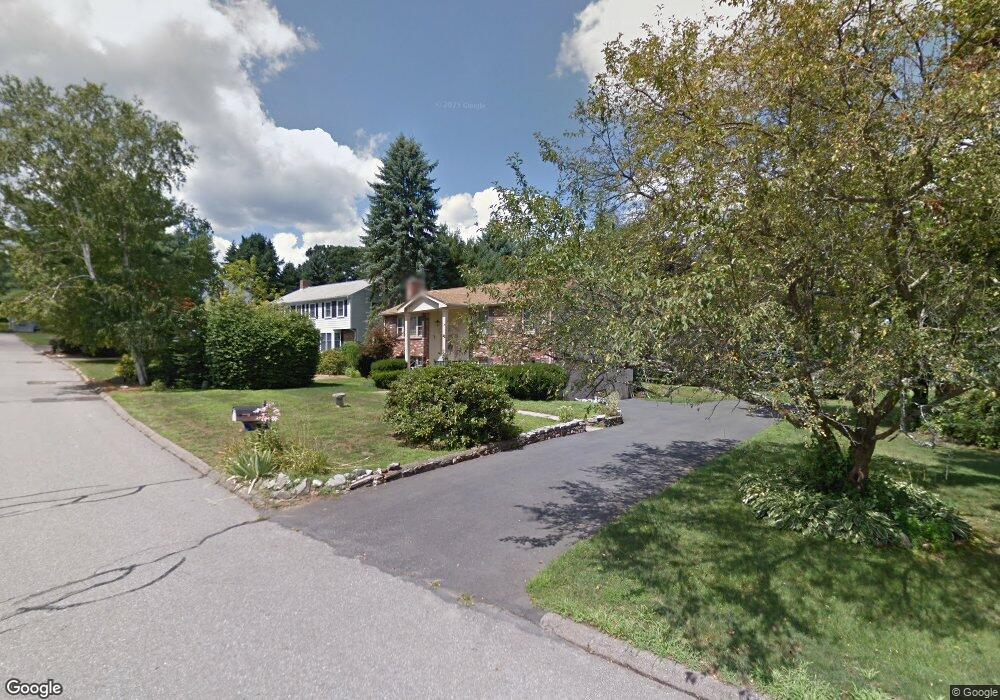
8 Pinecone Ln Southborough, MA 01772
Estimated Value: $643,268 - $800,000
3
Beds
2
Baths
1,170
Sq Ft
$621/Sq Ft
Est. Value
About This Home
This home is located at 8 Pinecone Ln, Southborough, MA 01772 and is currently estimated at $726,817, approximately $621 per square foot. 8 Pinecone Ln is a home located in Worcester County with nearby schools including Mary E Finn School, Albert S. Woodward Memorial School, and Margaret A. Neary School.
Ownership History
Date
Name
Owned For
Owner Type
Purchase Details
Closed on
Sep 2, 2025
Sold by
Simons Elliott S
Bought by
Elliott S Simons T S and Elliott Simons
Current Estimated Value
Purchase Details
Closed on
Mar 7, 2008
Sold by
Simons Elliott S
Bought by
Simons Elliott S and Simons Nancy T
Purchase Details
Closed on
Jul 18, 1997
Sold by
Ryu Jaesok and Ryu Yongeun
Bought by
Simons Elliott S
Home Financials for this Owner
Home Financials are based on the most recent Mortgage that was taken out on this home.
Original Mortgage
$79,000
Interest Rate
7.79%
Mortgage Type
Purchase Money Mortgage
Purchase Details
Closed on
Sep 25, 1992
Sold by
Woods Carol A
Bought by
Ryu Jaeseok and Ryu Yongeun
Create a Home Valuation Report for This Property
The Home Valuation Report is an in-depth analysis detailing your home's value as well as a comparison with similar homes in the area
Home Values in the Area
Average Home Value in this Area
Purchase History
| Date | Buyer | Sale Price | Title Company |
|---|---|---|---|
| Elliott S Simons T S | -- | -- | |
| Elliott S Simons T S | -- | -- | |
| Simons Elliott S | -- | -- | |
| Simons Elliott S | -- | -- | |
| Simons Elliott S | -- | -- | |
| Simons Elliott S | -- | -- | |
| Simons Elliott S | -- | -- | |
| Simons Elliott S | $197,000 | -- | |
| Simons Elliott S | $197,000 | -- | |
| Ryu Jaeseok | $175,000 | -- | |
| Ryu Jaeseok | $175,000 | -- |
Source: Public Records
Mortgage History
| Date | Status | Borrower | Loan Amount |
|---|---|---|---|
| Previous Owner | Ryu Jaeseok | $100,000 | |
| Previous Owner | Ryu Jaeseok | $79,000 |
Source: Public Records
Tax History
| Year | Tax Paid | Tax Assessment Tax Assessment Total Assessment is a certain percentage of the fair market value that is determined by local assessors to be the total taxable value of land and additions on the property. | Land | Improvement |
|---|---|---|---|---|
| 2025 | $9,113 | $659,900 | $319,200 | $340,700 |
| 2024 | $9,008 | $647,600 | $314,800 | $332,800 |
| 2023 | $8,964 | $607,300 | $297,900 | $309,400 |
| 2022 | $8,710 | $535,000 | $259,200 | $275,800 |
| 2021 | $4,223 | $504,900 | $263,600 | $241,300 |
| 2020 | $8,370 | $502,400 | $253,600 | $248,800 |
| 2019 | $8,027 | $479,500 | $240,100 | $239,400 |
| 2018 | $7,319 | $453,500 | $231,000 | $222,500 |
| 2017 | $7,101 | $433,500 | $231,000 | $202,500 |
| 2016 | $6,692 | $423,000 | $231,800 | $191,200 |
| 2015 | $6,615 | $412,900 | $218,100 | $194,800 |
Source: Public Records
Map
Nearby Homes
- 19 Maplecrest Dr
- 150 Framingham Rd
- 4 Latisquama Rd
- lot 1 Sears Rd
- 26 Meadow Ln
- 24 Meadow Ln
- 56 Sears Rd
- 14 Mitchell St
- 32 Sears Rd
- 1 Carriage Hill Cir Unit 1
- 37 Boivin Dr
- 146 Framingham Rd
- 47 Central St
- 58 Pine Hill Rd
- 12 Wyndemere Dr
- 39 Desimone Dr
- 6 Angelica Ln
- 61-65 Turnpike
- 216 Boston Rd
- 620 Farm Rd
Your Personal Tour Guide
Ask me questions while you tour the home.